And if so, would now be the right time to play them? The S&P downgrade should pretty much wash away the lower interest rates that the last round of QE produced. The Dow is in the process of puking up it's QE induced rise faster than an incontinent baby. (see the charts and analysis from dshort.com below) You can say the recent decline is due to other factors, but I see it as a direct result of "No Mo' POMO"
Your move Benny. I understand you have this thing called the printing press. Perhaps now would be the time to crank it up again? Definition of insanity.
All eyes on you this week Benny. Don't disappoint those "reverse Pavloivian dogs" of the financial markets and the "crisis creators" in DC. They work hand in glove, even as they appear at times -- like acts in a play -- to be at odds with each other.
Chart of the Day: Anticipating QE3:
"If a picture is worth a thousand words, this chart needs little additional explanation — except perhaps for those who are puzzled by the Jackson Hole callout. The reference is to Chairman Bernanke's speech at the Fed's 2010 annual symposium in Jackson Hole, Wyoming. Bernanke strongly hinted about the forthcoming Federal Reserve intervention that was subsequently initiated in November, namely, the second round of quantitative easing, aka QE2. The NY Times captured the essence of the speech here.-----
Will there be a round three? Do children like Disneyland?"
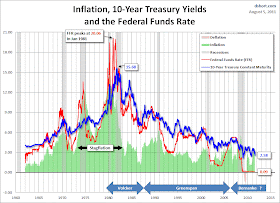
Treasury Yields in Perspective:
"Quick take: Since the end of QE2, the yield on the 10-year note has dropped 60 basis points to 2.58%. The most recent Consumer Price Index (the July reading for June) stands at 3.56%, which gives us a real 10-year yield of -0.98%. In the wake of Standard & Poor's downgrade of U.S. long-term debt, it will be especially interesting to review this metric in the weeks ahead.
Let's have a look at a long-term perspective on Treasury yields. The chart below shows the 10-Year Constant Maturity yield since 1962 along with the Federal Funds Rate (FFR) and inflation. The range has been astonishing. The stagflation that set in after the 1973 Oil Embargo was finally ended after Paul Volcker raised the FFR to 20.06%."


No comments:
Post a Comment