So let me see if I have this straight? A small sample size can be a problem according to the Fan Graphs article below, But a large sample size can also present problems according to Relevant Insights? What's a stat geek to do?
From Fan Graphs: "Also, a quote worth remembering: 'In small sample sizes, a good scout is ALWAYS better than stats.'"
Maybe in both small and large sample sizes, it's good to have the eyes, ears and guts of a seasoned scout to guide an organizations fortunes.
from Relevant Insights:
http://www.relevantinsights.com/representative-sample
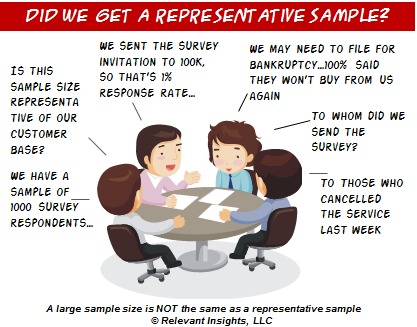
I often get asked "What sample size do I need to get a representative sample?" The problem is that this question is not formulated correctly.
Sample size and representativeness are two related, but different issues. The sheer size of a sample is not a guarantee of its ability to accurately represent a target population. Large unrepresentative samples can perform as badly as small unrepresentative samples.
A survey sample's ability to represent a population has to do with the sampling frame; that is the list from which the sample is selected. When some parts of the target population are not included in the sampled population, we are faced with selection bias, which prevent us from claiming that the sample is representative of the target population. Selection bias can occur in different ways:
from Fan Graphs:
Sample Size | FanGraphs Sabermetrics Library:
Sample Size
So we have all of these statistics, but when can we use them? Suppose a player goes three for three in their first game in the big leagues. Should we expect this player to continue batting 1.000 for the rest of the season? Of course not, that’d be silly. Three at-bats is way too small a sample to draw conclusions about a player, but then we’re left with the question: at what point do statistics become reliable?
There has been a lot of research done in this area by Russell Carleton (AKA: the artist formerly known as Pizza Cutter). For his most recent work, you can find his full research at Baseball Prospectus. We’ve included links and a summary below:
Stabilization Points for Offense Statistics:
- 60 PA: Strikeout rate
- 120 PA: Walk rate
- 240 PA: HBP rate
- 290 PA: Single rate
- 1610 PA: XBH rate
- 170 PA: HR rate
- 910 AB: AVG
- 460 PA: OBP
- 320 AB: SLG
- 160 AB: ISO
Stabilization Points for Pitching Statistics:
- 80 BIP: GB rate
- 80 BIP: FB rate
- 600 BIP: LD rate
- 50 FBs: HR per FB
- 820 BIP: BABIP
- 70 BF: Strikeout rate
- 170 BF: Walk rate
- 640 BF: HBP rate
- 670 BF: Single rate
- 1450 BF: XBH rate
- 1320 BF: HR rate
- 630 BF: AVG
- 540 BF: OBP
- 550 AB: SLG
- 630 AB: ISO
In case it’s not obvious, you can tell a lot more about a hitter from one year of data than you can about a pitcher. If a statistic is not included, the means it did not stabilize over the intervals that Russell Carleton tested.
- 70 BIP: GB rate
- 70 BIP: FB rate
- 650 BIP: LD rate
- 400 FB: HR per FB
- 2000 BIP: BABIP
Also, a quote worth remembering: “In small sample sizes, a good scout is ALWAYS better than stats.”
'via Blog this'
No comments:
Post a Comment