Part One: Open Letter to UNF Athletics: What's Cool on Campus - Data Analytics (UPDATE)
JACKSONVILLE, FL - After my initial research on the topic in September 2019, I continued researching data analytics adoption at the NCAA team level, adding six teams to the initial survey presented to the administration.
The approximate 4 - 6 increase in wins over the trailing eight-year average of wins -- or wins expected -- remained in place.
The approximate 4 - 6 increase in wins over the trailing eight-year average of wins -- or wins expected -- remained in place.
Growing number of programs finding or renewing success: (2019 record versus 2011-18 record)
Next, I looked at the final 2019 College Baseball poll from USA Today. I added a Y/N to sort for teams that had publicly announced their use of data analytics. An earlier USA Today article had mentioned Louisville and Texas Tech as College World Series participants that did not have an existing analytics program in place.
from USA Today:
https://www.usatoday.com/sports/ncaa-baseball/polls/coaches-poll/2019/
from USA Today:
https://www.usatoday.com/sports/ncaa-baseball/polls/coaches-poll/2019/
2019 Final USA Today College baseball Poll - by adoption of data analytics
- Seventeen of the Top 25 teams had adopted data analytics (68% rate).
- Adoptees median number of Wins were 4 greater than non-adoptees, W% was 0.031 greater, which implies approximately +2 Wins.
- Adoptees tended to play later into the post-season than non-adoptees.
- In other words, adding 2 - 4 wins while playing amongst the most competitive sub-set of teams you could select is meaningful.
Next, I looked at adoption rate by conference. Here is where I feel the story began to expand and crystallize.
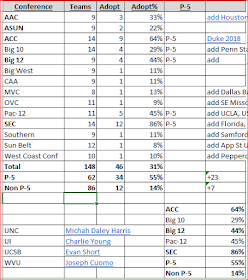
I examined the Power-5 conferences (P-5) and selected Non P-5 conferences like the ASUN. This revealed the following:

- The Power Five conferences (P-5) adopted at a 55% rate versus 14% for Non P-5 conferences.
- The SEC had adopted at 86% rate and the ACC at 64% rate, the highest rates observed.
- The SEC is on track to hit 100% by 2021.
- The Power 5 Conferences are on track to hit 100% by 2022.
Non P-5 schools, by contrast, are on an estimated adoption rate that mimics MLB's rate of increase (as shown below). This puts them on path to hit 100% by approximately 2032.
That 10-year gap, if the Non P-5 status didn't do it, will relegate these schools to long-term, if not permanent, 'have-not' status in collegiate baseball.
Year 1 = 1997 for MLB and 2017 for college baseball.
Elitzur's MLB Timeline of Adoption (SABR teams over time)
These conclusions, if they hold true, are somewhat ironic in that one pillar of the Moneyball Theory and Dr. Elitzur's study, is that in MLB, poorer teams used data analytics to gain advantage against richer teams, in what was inherently an unfair contest between unequals.
The analogy to college baseball flips that framework on its head in that richer teams are adopting it to further cement their advantage over less well-endowed competitors.
Cum Wins v. Cum Payroll (1998-2016) - Avg. Payroll v. Diff. Wins vs. Expected Wins
Sum of Wins Over or Under Expected Wins and Avg Payroll Level
Here is where things get interesting. I examined cumulative wins (from baseball-reference.com) versus cumulative payroll (from Lahman database) and applied conditional formatting to identify the top ten teams (green) and the bottom ten teams (red) by each category. The (white) cells are the middle teams per category.
In the first category, cumulative wins and cumulative payroll, the Red Sox and Yankees (coded green-green) bludgeoned the field as top ten in payroll and top ten in wins. Not a huge surprise.
Pittsburgh and the Rays (coded red-red) were bottom ten in both categories and that is not a huge surprise either. A 0.77 correlation between wins and payroll should come as no surprise either, it's the basis for the so-called "competitive balance tax" or de-facto salary cap.
Cum. Wins v. Cum. Payroll (1998-2016) grouped by 10's
If you expand the conditional formatting here to show top ten-bottom ten-middle ten by category, you get some unusual pairings.
Green-Green = BOS,LAA,LAD,NYY,SFG,STL
Green-White = ATL,CLE,TEX
Green-Red = OAK
White-Green = CHC,NYM,PHI
White-White = CHW,CIN,HOU,SEA,TOR
White-Red = ARI,MIN
Red-Green = DET
Red-White = BAL, COL,
Red-Red = KCR,MIA,MIL,PIT,SDP,TBR
This analysis looks at the absolute level of spending and the absolute level of wins. The top and the bottom level teams are segregated on that basis with only Oakland delivering on the upside as far as wins relative to payroll in aggregate which makes sense. They are the crown princes of Moneyball.
Detroit finishing lower third delivering wins while spending in the upper third on the payroll side makes them the anti-Moneyball franchise so far.
But is that the fairest way to grade franchise when the premise is to spend money efficiently rather than wastefully or recklessly?
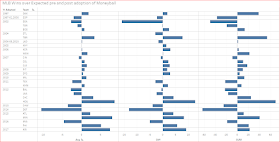
Sum of Wins Over or Under Expected Wins and Avg Payroll Level
From the baseball-reference.com historical wins by team/year data, an "expected wins" field was created by weighting the prior three years win total, as is commonly done with projections.
2019EW for example would be ((2018 W * 3) + (2017 W * 2) + (2016 W * 1)) / 6.
2019EW for example would be ((2018 W * 3) + (2017 W * 2) + (2016 W * 1)) / 6.
OUW would then be the Over / Under of Actual Wins versus Expected Wins.
I applied the same conditional formatting rules to sort in top-middle-low ten team buckets and calculated the following matrix of Wins Expected versus Average Payroll.
Elitzur Wins - Payroll Matrix
In my opinion, this gives a reasonable snapshot of which teams are more successfully employing the Moneyball concept of "doing more with less."
High Wins over Expected with Low Payroll:
Oakland, Tampa Bay and Minnesota have had good success doing more with less. Arizona and Washington are also consistently on top pf their divisions.
Low Wins over Expected with High Payroll:
Detroit and the Los Angeles Angels have had a bad run while spending at some of the highest levels. A bad combination recently.
High Wins and High Payroll:
Boston, Chicago Cubs and Philadelphia fall into this category. High spending but high wins over expectations to match.
High Wins with Middle range Payroll:
Cleveland Indians with some consistently good years and the Houston Astros with some feast or famine years and a relatively new adoptee of data analytics (2012) scored well on Over/Under Wins, especially recently.
This introduces another interesting observation which may appear to run counter to one of the earlier observations, that "if you were not in early, you were left behind."
click link above to see in Tableau:
Some teams who were late adopters of an analytics driven approach have had recent success in terms of wins above expectations (OUW):
Houston and Chicago Cubs (2012) and +8.63 / +3.06 OUW
Minnesota (2015) and +8.06 OUW
Philadelphia (2016) and Arizona (2017) +5.08 / +7.44 OUW
Houston and the Cubs have had good success but will regress somewhat as they add more years under adoption. Minnesota, Philadelphia and Arizona are more recent small sample size successes with only three to four years under adoption.
Those team's recent successes, added to the previous success of the A's and the Rays, lend themselves to a belief that the teams that "need" to succeed with a Moneyball approach the task with a "have to have this work" mentality rather than a "nice to have" it work, if not throw some money at the problem. Failure is an ever-looming, existential threat to their success. This leads to a deeper commitment to the task and a greater buy in from everyone in those organizations.
For the high payroll, high to middle success teams, data analytics is "nice to have" but not really "have to have". There is a safety net of the owners checkbook, an "in case of fire, break glass" option lesser well-endowed teams do not have, that blurs the amount of credit that should be given to data analytics for success in the W column. The low payroll teams are overcoming the 0.76 correlation between payroll and wins, the high payroll teams are surfing it to success.
Each successive CBA defines the rules of engagement teams operate under and they naturally lend themselves to this type of stratification and perhaps always will. Organizations and staff at all levels are constrained by these rules and work with them and in some cases around them to the best of their ability in order to succeed.
On the collegiate side of the ball, college teams that lag in adoption could see some glimmer of hope from the late-adopters in MLB, however with the greater disparity and distribution of talent and the differences in the rules of engagement the NCAA and their member conferences set up between the teams, that glimmer of hope quickly morphs into a chasm of despair.
Going forward, I would like to take more of a flow versus stock comparison, ie: change in Win Expectation versus Y-O-Y changes in payroll historically and see what that reveals.
References:
Elitzur, Ramy. “Data analytics effects in major league baseball.” (2020).


No comments:
Post a Comment