|
Thursday, May 01, 2025
Eldridge homers in first AB of 2025


Saturday, April 19, 2025
Three Giants prospects who are off to hot starts - Giants Beat
Some of us old goats remember when the Giants would develop prospects. Exciting prospects.
This doesn't even include Bryce Eldridge and LHP Carson Whisenhunt. So, short-term, pipeline looks good. Slightly longer term, not too shabby as well.
Saturday, April 12
The Giants have emerged as one of the early surprises of the 2025 season, with Jung Hoo Lee, Wilmer Flores and Mike Yastrzemski among the hitters who have powered the club's strong start to the year.
But the positive developments haven't been limited to the big league club.
Here's a look at three Giants prospects who have also come strong out of the gate in the Minors this year:
1. Carson Seymour, RHP (Giants' No. 20 prospect per MLB Pipeline)
Triple-A Sacramento's rotation features plenty of notable names, including Kyle Harrison, Keaton Winn and Carson Whisenhunt (No. 2), but the unit's most impressive starter thus far has been Seymour, who has logged a 0.64 ERA with 17 strikeouts over 14 innings across his first three outings of the year. The 26-year-old right-hander racked up 13 K's over nine shutout innings over his first two starts, which earned him Pacific Coast League Pitcher of the Week honors for the week of April 1-6.
Seymour was added to the Giants' 40-man roster in November, so he should be part of the next wave of young starters who could debut in San Francisco in the not too distant future.
2. James Tibbs III, OF (No. 4)
The Giants' 2024 first-round Draft pick, Tibbs earned a quick promotion after batting .415 over nine games at Single-A San Jose last summer, but he cooled off significantly once he reached the Northwest League. The 22-year-old outfielder hit only .134 with two home runs and 25 strikeouts over 17 games with High-A Eugene in 2024, a mildly concerning stretch for a player who was viewed as one of the most advanced hitters in his Draft class.
Tibbs returned to High-A Eugene for the start of the 2025 campaign, but he's making a far better impression at the plate this time around. He entered Friday having hit safely in each of his first five games for the Emeralds, batting .368 (7-for-19) with a 1.152 OPS and one homer over that span. Tibbs reached base in seven of his first eight plate appearances to start the year and capped that stretch by crushing his first home run of the season -- a solo shot to straightaway center field -- against Hillsboro on April 5.
Tibbs' former Florida State teammate, Cam Smith, was taken one pick after him in last year's Draft and is already in the Majors with the Astros, so the Giants will hope to see a similarly fast rise from their own first-rounder this year.
3. Dakota Jordan, OF (No. 6)
The Giants gambled on Jordan's tantalizing upside when they took the power-hitting outfielder in the fourth round of the 2024 Draft. The early returns have been promising so far this year. Jordan entered Friday batting .364 (8-for-22) with one home run, six RBIs and two stolen bases over his first six games with Single-A San Jose. The 21-year-old hammered his first professional homer against Visalia on Wednesday, launching a two-run shot over the center-field wall to cap a three-hit night at Excite Ballpark.
Strikeouts remain an issue for Jordan, who has whiffed in seven of his first 22 at-bats, but he's made some tweaks to his batting stance since joining the Giants organization and is now standing taller to try to stay more relaxed in the box.
"When it comes to the hitting part, I would say it's 50 percent for me," Jordan said before the Giants' Spring Breakout game last month. "I've got the quick bat, the quick twitch. For me, I don't need to be all jumpy and everything. Really for me, whenever I'm hitting, I just sit back and relax now. That's something that I've learned even in my cage routines now. You don't have to hit, hit, hit. You can hit, take a breather, catch your breath. That's something that I learned. Being able to breathe and relax and have fun."


Saturday, January 20, 2024
Marco gets a wide range of evaluations from BP.com

The following from one of Baseball Prospectus' correspondents and yet Marco is also listed as the Giants #1 prospect in aother article.
That may speak poorly of the Giants current shallow pool of prospects. Giants fans have been through this before but, for the love of Wendell Fairley, does not even a blind squirell occasionally find himself a nut?
Maybe the Giants scouting and player development minions are less sskilled at their primary jobs than the proverbial blind squirell is at his.
from Baseball Prospectus.com:
Luciano is the personification of prospect fatigue, having been a fixture on prospect lists longer than I’ve been employed by BP. A lot of Luciano’s past rankings were when the public side was way, way behind on identifying traits that translate to big league production. Had we had things such as zone contact rates and SEAGER scores when Luciano was climbing the minor league ranks, there’s a chance Luciano is even further down this year’s ranking, if on it at all.
Luciano isn’t dissimilar to Ronny Mauricio, who notably isn’t on this list. He has plus-plus bat speed that’s looked a lot more like just plus at times of late, and he struggles to pick up any spin out of the pitcher’s hand. He’s in the dead zone where he chases too much and doesn’t make enough contact in the zone to justify said chases issues. The bat speed and Luciano’s surprising ability to stick at the 6 are literally the only things keeping his current ranking afloat. But the ship has sunk and Luciano’s strapped into the lifevest, hoping he can make it to shore before his stock sinks to the ocean floor. —Smith Brickner
Tuesday, December 19, 2023

Tuesday, December 20, 2022
Youth Sports Participation - State of Play in the USA

After a large decline during COVID, youth sports participation is back on the rise.
But overall, participation is still down compared to pre-pandemic levels. And even worse, the United States has a less-than-stellar report card when it comes to youth physical activity.
Participating in sports has been found to increase both physical and mental health among children. In fact, a recent study shows that 58.4% of parents found that their child's mental health greatly improved as a result of involvement in sports. And, 71% cited improved social well-being.
Unfortunately, 27% of parents reported that their child lost interest in playing sports all together.
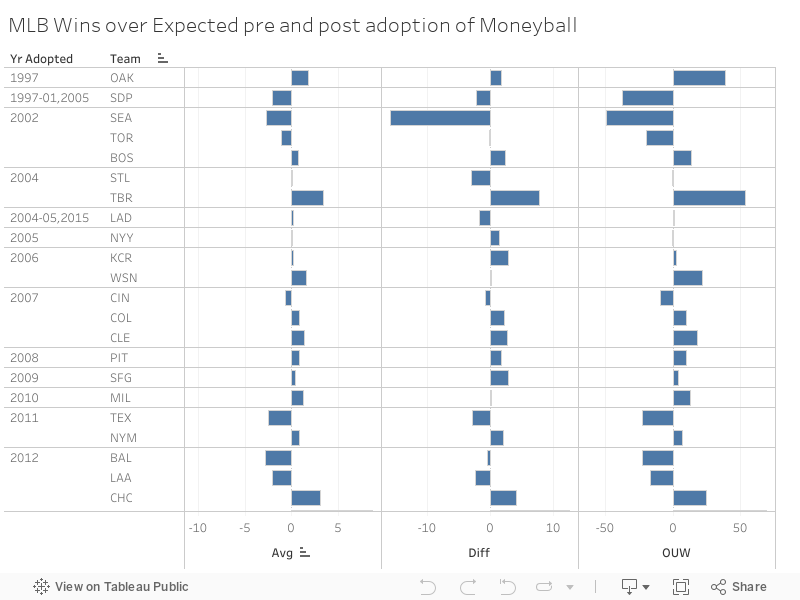
MLB Wins over Expected Wins pre and post adoption of Moneyball by Charles Slavik

Thursday, February 03, 2022
The legend of Moonlight Graham

“We just don’t recognize life’s most significant moments while they’re happening.” - Moonlight Graham (Field of Dreams)
Archibald Wright "Moonlight" Graham (November 12, 1876 – August 25, 1965) was an American professional baseball player and medical doctor who appeared as a right fielder in a single major league game for the New York Giants on June 29, 1905. His story was popularized by Shoeless Joe, a novel by W. P. Kinsella, and the subsequent 1989 film Field of Dreams, starring Kevin Costner, and featuring Burt Lancaster and Frank Whaley, respectively, as older and younger incarnations of Graham.
As the movie suggests, somewhat tragically, Graham came close but never reached his dream. But Graham, played by Burt Lancaster, famously says,
“If I‘d only gotten to be a doctor for five minutes, now that would have been a tragedy.”
Wednesday, January 05, 2022
Stathead: HOF Spotlight

Once again, not sure what the voters are looking for. I think Kent checks all the boxes and yet he is on his next to last year on the ballot.
They made Ortiz's case on the same day. Why not, keeping Bonds out is good enough for most of the electors because they care more about how players treated the media than almost anything else.
HOF Candidate Spotlight
 | WAR: 55.5 Better than 36.4% of HOFers Black Ink: 0 Better than 0.0% of HOFers Gray Ink: 71 Better than 11.7% of HOFers HOF Monitor: 122.5 Better than 40.5% of HOFers JAWS: 45.62 Better than 35.0% of HOFers at 2B |
Jeff Kent enters his 9th year on the ballot. After hovering in the teens for most of his eligibility, he has made a jump in the last two cycles and peaked at 32.4% of the vote last year. Kent was an average starter for most of the 1990s, not finding his peak performance until joining the San Francisco Giants in 1997. During his 6-year Giants tenure he finished in the top 10 of MVP voting 4 times, including winning the NL MVP in 2000 over his teammate Barry Bonds.
Kent provided a lot of offensive value from a traditionally weaker position of second base. Kent hit 351 of his home runs as a second baseman, the record holder by a decent amount. Kent was not a top defender at the position, only surpassing 1.0 defensive WAR in his 1997 season. That being said, his total value was the best among 2nd basemen for a time. From 1997-2005, Kent recorded 42 WAR, with the next closest 2nd baseman being Craig Biggio with 32 WAR in that time span.
Tuesday, January 04, 2022

Luciano, Murphy lead next wave bound for Bay
Sounds like Luciano, Pomares & Matos replace Bart & Ramos, who need to produce at MLB level. No sleepy on Harrison (LHP) or the 5-9 C Aurebach. :)
When the smallish kids open eyes, that bears watching.
Thursday, December 23, 2021
Happy Birthday Jerry Koosman!!

Koosman was underrated IMO. Toiled somewhat in the shadow of Seaver and some of the other phenoms that came through Shea Stadium. That 53.7 WAR doesn't lie.
Thursday, December 23
Born This Day
1942: Jerry Koosman: 53.7 WAR (turns 79)
1978: Victor Martinez: 32.0 WAR (turns 43)
1980: Cody Ross: 13.5 WAR (turns 41)
1983: Hanley Ramirez: 38.0 WAR (turns 38)
1988: Roberto Perez: 7.5 WAR (turns 33)