Since we are approaching the time of year where scouts prove their value to organizations, a look at how / where some of the terminology and grading scales came from.
The Kiley McDaniel series from FanGraphs (below) on the scouting scale is an instant classic, must read -- off the charts excellent -- an 80-grade reader for both the scouting novice and aficionado. The article from slowrollinlow (also below) is a good primer if you just want the Readers Digest version. Either way, happy reading.
So, 50 is a projected average major league player and there aren't that many of them in any particular draft ( maybe 68 or so in this one ), so they get snapped up fast. By the second or third round, virtually all of the 50's will be gone.
That correlates with eventual success, as defined as any particular draftee "making" it to "The Show". Long-term the numbers show that:
- 1st round picks (and each team has only one per year) succeed at 66% success rate
- 2nd round picks succeed at a 49% success rate
- 3rd through 5th rounders ( and there are three of them per year ) succeed at a 32% rate
- 6th through 10th rounders ( and there are five of them ) succeed at a 20% rate
- 11th through 20th rounders ( and there are ten of them each year ) succeed at an 11% rate
- 21st through 40th rounders ( and there are twenty of them each year ) succeed at a 7% rate
Because of attrition, each organization is going to winnow through prior years draft picks and make decisions based on organizational needs and player development. Obviously. there is some selection bias and self-fulfilling prophecy in that higher draft picks, with correspondingly higher sunk costs are going to get longer, harder looks but the system and the process seems to work fairly well with almost machine like mathematical precision across the board.
From each years draft, it seems like there will be one player from each bucket, with 1st and 2nd rounders constituting a single bucket of premium players, and if you review each teams draft 5-10 years down the road, you can almost see this pattern play out time after time. There is opportunity at every level for success and every year there are stories of un-drafted players or Independent League players making a splash into the major league pool.
The better organizations obviously do better with the premium picks. Rounds 1-5 you really have to know your business, after that if any one inside or outside the industry tells you it's more skill than luck, they are probably not telling you the truth.
from slowrollinlow blog:
Spring Training – 2014 | slowrollinlow:
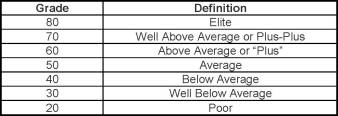
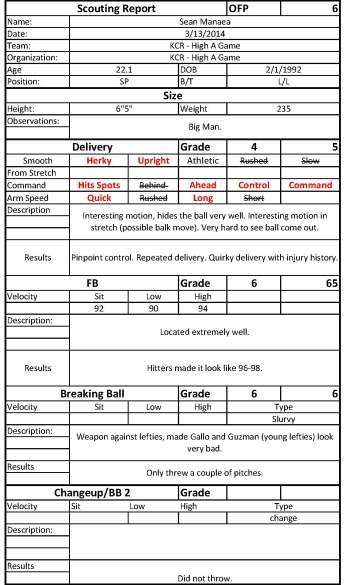
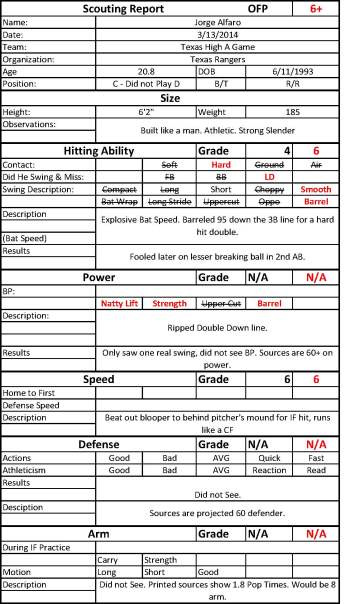
How to read a baseball scouting report:Baseball scouts use the 20-80 scale to describe a players current and future tools. In general the tools being described for position players are the “five” premier tools like hitting ability, power, speed, defense, and arm. For pitchers the tools being rated are generally each pitch, command of pitches, and control. I’ve also graded each pitchers delivery. The 20-80 scale is a rating from poor to elite.
The scale goes from 20-80 in part because it is built like a bell curve for major league baseball players. While there aren’t that many 50 grade hitters in the world, there are a lot more 50 grade hitters in the big leagues at any point in time than there are 20 grade hitters or 80 grade hitters. Elite grades are given very infrequently and are generally the best in the game type of grades.
'via Blog this'
from fangraphs.com
http://www.fangraphs.com/blogs/scouting-explained-the-20-80-scouting-scale/
Objective Tool Grades
Tool Is Called Fastball Velo Batting Avg Homers RHH to 1B LHH to 1B 60 Yd Run 80 80 97 .320 40+ 4.00 3.90 6.3 75 96 .310 35-40 4.05 3.95 6.4 70 Plus Plus 95 .300 30-35 4.10 4.00 6.5 65 94 .290 27-30 4.15 4.05 6.6 60 Plus 93 .280 23-27 4.20 4.10 6.7 55 Above Avg 92 .270 19-22 4.25 4.15 6.8 50 Avg 90-91 .260 15-18 4.30 4.20 6.9-7.0 45 Below Avg 89 .250 12-15 4.35 4.25 7.1 40 88 .240 8-12 4.40 4.30 7.2 35 87 .230 5-8 4.45 4.35 7.3 30 86 .220 3-5 4.50 4.40 7.4
This is a table showing the tool grades (fastball for pitchers, hit, power and speed for hitters) that have objective scales that every scout uses to grade. These scales will vary team to team, possibly shifted one notch in either direction, or maybe separate grades for fastball velocity for righties/lefties or starter/reliever but these are essentially industry consensus scales.
An 80 tool is called 80. It’s really rare, so why do we need another name for it? 75 is almost never used because scouts will yell at you to make a choice and many don’t use 65, though it’s much more accepted than 75. These half grades like 65 and 75 don’t have separate terms because many teams use a 2-8 scale rather than 20-80 and 2-8 is the scale that was predominant when many of today’s top scouts were starting out. Now 20-80 is more commonly used, but often you’ll hear older scouts at the ballpark throwing out single numbers like 6 or 7 while we might call that a 65 here. It helps in my situation to have more numbers describe things when I’m trying to differentiate between literally hundreds of prospects that have 50 or 55 power grades, for example.
One more important addition to the scale that isn’t shown here is solid average (52.5) and fringe-average or fringy (47.5). Since so many tools fall close to 50 but you may clearly prefer one 50 to the other, many scouts will use these terms to differentiate. Again, given the thousands of players I’ll be grading, it makes sense to use this and it will show up as 45+ or 50+, since no scout has or ever will write 52.5 or 47.5 (they just put 50 then say fringy or solid average in the comments).


No comments:
Post a Comment