
It's a long way to go, but well worth the trip. - CS
http://news.wustl.edu/news/Pages/27028.aspx
Incentive gaming is when people manipulate pay-for-performance schemes in ways that increase their compensation without benefitting the party that pays.
“It’s an example of how innovative people can be when there are financial rewards involved,” Pierce said.
What top officials at the VA may have overlooked, however, was a test of their system before implementing it.
“Designers of incentive-based compensation systems must think carefully about unintended consequences, putting themselves in the shoes of their employees and asking, ‘If I were given these incentives, what might I do to game them?’ ”
“Managers and policymakers need to understand that humans are clever and often opportunistic,” Pierce said. “If you give them an incentive system, many of them will figure out how to manipulate it to maximize pay and minimize effort.”
Pierce noted that the allegations involving the VA, as in frequent cases of standardized test gaming by teachers, are particularly striking for two reasons.
First, it shows the difficulty of inserting financial incentives into a setting where they are not traditionally used — the federal government.
“Many people erroneously see financial incentives as a panacea for perceived examples of government inefficiency such as education, health care or procurement,” he said.
Second, it shows that financial incentives can overwhelm even values that often are represented as routine.
“If even small financial incentives can overwhelm strong societal values such as educating children and caring for those who served our country, then such problems can occur anywhere,” Pierce said.
The Dangers of Managing to Metrics | BOMGAR
_350_233.jpg) | |||||||
The Dangers of Managing to Metrics | BOMGAR
Support centers run their business and make critical decisions based on metrics. However, often times the metrics are not giving leadership a true representation of...
| |||||||
Preview by Yahoo
| |||||||
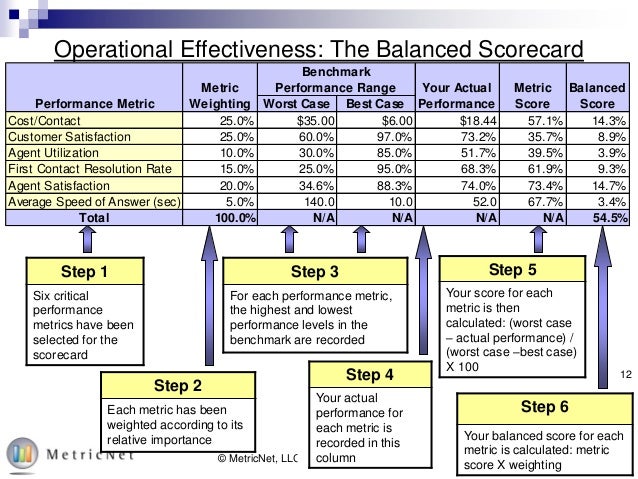
Support centers run their business and make critical decisions based on metrics. However, often times the metrics are not giving leadership a true representation of the state of the business due to both unbalanced and self-reported (biased) metrics.
Whether or not you have kids in school, there's a good chance you've heard plenty of arguments against the practice of "teaching to the test," where teachers are forced to focus on preparing students for standardized tests, rather than teaching a well-rounded curriculum for the grade level and subject matter. Higher scores on the standardized tests lead to better teacher ratings and school rankings, but do not necessarily promote the entire education experience required for the student to be successful at the next level. Imagine if you would, a football coach who only practices punt returns or a basketball coach only focused on free throws. The team would be great at these single tasks, but would they ever be able to actually win a game?
It may not be seen as "teaching to the test," but the same practice occurs in many support centers around the globe when management does not use a balanced scorecard. Instead, agents are encouraged to focus on just one or two metrics, such as Average Handle Time (AHT), Customer Satisfaction (CSAT), Quality, or Issue Resolution (IR). The agents quickly learn to do well based on the metrics they are being measured against and neglect the rest of what is important to both the business and the customer. Below are a few examples I've seen.
- Focus on AHT - A particular computer tech support call center I worked with had dissatisfied customers because of long wait times to reach an agent. Management realized that agent call handle times were extremely long, so they shifted focus from quality to AHT. The agents were given shorter talk time targets, which were reported weekly. The agents knew their performance evaluations would be based on their reported AHT, so their solution was to "fix" the majority of issues by telling the customers to reinstall the operating system and call back if they needed help after the reinstall was complete. Most of these issues, it turned out, did not need an OS reinstall. This caused a lot of unnecessary churn for the customers (not to mention data loss), simply because the agents did not want to take the necessary time to troubleshoot the true issue. In the end, handle times were great - but to the detriment of repeat calls, issue resolution and customer satisfaction - costing the company more money than they were saving by shortening handle times.
- Focus on CSAT - Customer loyalty is very important to the long term success of any business, as dissatisfied customers will not only share their negative experience with others, but also not be repeat customers themselves. However, singular focus on CSAT can easily drive up costs unnecessarily. One customer service call center was seeing an increase in negative customer satisfaction surveys. In response, the primary goal became raising CSAT scores. As a result, agents began abusing concessions available to them to pacify customers. They weren't resolving the issues or reason for complaint at a higher rate. They were simply giving customers more free products and coupons for future purchases, while specifically telling them to be sure to give favorable scores on the email survey they would receive. Not only did this behavior cause higher costs in concessions, but it also drove up repeat calls once the customers realized their issues were not really resolved over time.
Equally as dangerous in managing to metrics is the practice of self-reported metrics, which is the equivalent of the fox guarding the hen house. Businesses need to have methods for ensuring efficiency and effectiveness, but it is possible for departments or groups to "game the system" in order to ensure good scores for rankings, ratings and even compensation. Below are two examples of the negative impact of self-reported metrics.
- Quality Monitoring - Team managers in support centers are rated by the quality of their agents. Some support centers have a quality team, but many times the team managers are responsible for evaluating and coaching their own agents. Low scores not only cause extra work for the manager by forcing them to coach the poor performers but also force managers to report the poor quality of their own team. This can lead to falsely elevated quality scores, which can ultimately drives lower CSAT and issue resolution, as well as higher handle times and repeat calls when undesirable agent behaviors are not corrected or improved. If agents are given false high quality scores, they will continue performing at the same level. It is important to ensure that quality and customer satisfaction scores are correlated by coaching and managing to appropriate levels.
- Issue Resolution - Often times IR is measured by agents reporting whether or not they believe the issue was resolved - not if the issue was actually resolved from the customer's perspective. I've seen many instances of agents claiming that the issue was resolved when it was out of their scope of support and they were unable to resolve it, claiming that they should not be scored against something out of their control. Again, the issue was not resolved and in the end will drive other metrics to be out of balance.
Design of a balanced scorecard ultimately is about the identification of a small number of financial and non-financial measures and attaching targets to them1. This should include the measures and targets for both inputs (i.e. contact volume, staffing levels) and outputs (service levels, abandon rates, issue resolution). Focus on balanced metrics can help a business quickly see where further analysis and improvements are need.
In order to collect unbiased feedback, care should be taken to ensure that everyone in the population being surveyed has an equal chance of being selected. For example, only surveying customers whose issues have been resolved eliminates feedback from customers with unresolved issues, missing opportunities for improvement. Also, when monitoring agent quality, sampling should occur at different times of the day. Agent behaviors can vary throughout the day, so using random times of the day can net varying opportunities for coaching and feedback.
Ultimately, a balanced score card measured by unbiased methods is critical to ensure a true picture of how the business and individual teams are performing. Without focus on both, agents are driving to undesirable performance and the business could be making unfavorable decisions.
GAMING INCENTIVES
September 16th, 2010
A couple of weeks ago, I listened to a very funny story about economic incentives on NPR. (Something funny on economic incentives?!)
The story was about an economics professor who decided to use incentives to shape the behavior of his children. He devised an incentive program for potty training–which his toddler gamed.
So when the time came to potty train his daughter, B., he designed what seemed like an economically rational incentive: B. would receive a jelly bean every time she went to the toilet.Once the new policy was in place, B. suddenly had to go to the toilet really, really often.A few years later, B.'s younger brother needed to be potty trained. And Gans decided to expand the incentive system: Every time B. helped her brother go to the bathroom, she would get a treat."I realized that the more that goes in, the more comes out," says B., who is now 11. "So I was just feeding my brother buckets and buckets of water."
I see lots of incentive programs like that–so obvious they could be gamed by a child. What are the people who devise these programs thinking? Sadly, when the simple incentives produce undesired results, they come up with ever more convoluted ways to elicit the desired behavior. (There's also a tendency to blame the people who gamed the incentive. Its as if the logic is: "We tried to manipulate you but you figured it out. Now we think you are a bad person for not cooperating with our attempt to manipulate you.")
Rather than try to manipulate adults in the workplace, why not appeal to intrinsic motivation? Tell people why something you want them to do is important, how it connects to the mission and financial results of the company. Then remove disincentives and barriers to doing the right thing.
Anyone contemplating trying to shape behavior with measurement and incentives should read Austin's Measuring and Managing Performance in Organizations. And then, consider that there might be a more congruent way to achieve the desired outcome.
- See more at: Gaming Incentives
 | |||||||
 | |||||||
The True Measures of Success - HBR
Most companies use the wrong performance metrics. Don't be one of them.
| |||||||
The Problem with Popular Measures
The most useful statistics are persistent (they show that the outcome of an action at one time will be similar to the outcome of the same action at another time) and predictive (they link cause and effect, predicting the outcome being measured). Statisticians assess a measure's persistence and its predictive value by examining the coefficient of correlation: the degree of the linear relationship between variables in a pair of distributions. Put simply, if there is a strong relationship between two sets of variables (say a group of companies' sales growth in two different periods), plotting the points on a graph like the ones shown here produces a straight line. If there's no relationship between the variables, the points will appear to be randomly scattered, in this case showing that sales growth in the first period does not predict sales growth in the second.
In comparing the variable "sales growth" in two periods, the coefficient of correlation, r, falls in the range of 1.00 to –1.00. If each company's sales growth is the same in both periods (a perfect positive correlation), r = 1.00—a straight line. (The values need not be equal to produce a perfect correlation; any straight line will do.) If sales growth in the two periods is unrelated (there is zero correlation), r = 0—a random pattern. If increases in one period match decreases in the other (a perfect inverse correlation), r = –1.00—also a straight line. Even a quick glance can tell you whether there is a high correlation between the variables (the points are tightly clustered and linear) or a low correlation (they're randomly scattered).
The closer to 1.00 or –1.00 the coefficient of correlation is, the more persistent and predictive the statistic. The closer to zero, the less persistent and predictive the statistic.
Let's examine the persistence of two popular measures: EPS growth and sales growth.

The figures above show the coefficient of correlation for EPS growth and sales growth for more than 300 large nonfinancial companies in the United States. The compounded annual growth rates from 2005 to 2007, on the horizontal axes, are compared with the rates from 2008 to 2010, on the vertical axes. If EPS and sales growth were highly persistent and, therefore, dependent on factors the company could control, the points would cluster tightly on a straight line. But in fact they're widely scattered, revealing the important role of chance or luck. The correlation is negative and relatively weak (r = –0.13) for EPS growth but somewhat higher (r = 0.28) for sales growth. This is consistent with the results of large-scale studies.
Next, we'll look at the predictive value of EPS growth and sales growth by examining the correlation of each with shareholder returns.

In the figures above, adjusted EPS growth and sales growth are on the horizontal axes. The vertical axes are the total return to shareholders for each company's stock less the total return for the S&P 500. Adjusted EPS growth shows a reasonably good correlation with increasing shareholder value (r = 0.37), so it is somewhat predictive. The problem is that forecasting earnings is difficult because, as we saw in the previous analysis, EPS growth in one period tells you little about what will happen in another. Earnings data may be moderately predictive of shareholder returns, but they are not persistent.
Using sales growth as a gauge of value creation falls short for a different reason. While sales growth is more persistent than EPS growth, it is less strongly correlated with relative total returns to shareholders (r = 0.27). In other words, sales-growth statistics may be somewhat persistent, but they're not very predictive.
Thus the two most popular measures of performance have limited value in predicting shareholder returns because neither is both persistent and predictive.
~;::::::;( )"> ¯\_( )_/¯
No comments:
Post a Comment