
Three important "Get and Stays" and a lot of this country's problems would disappear.
PROBLEM SOLVED. YOUR WELCOME!!!
It even makes Bloomberg embrace conservative values. It must be that obvious.

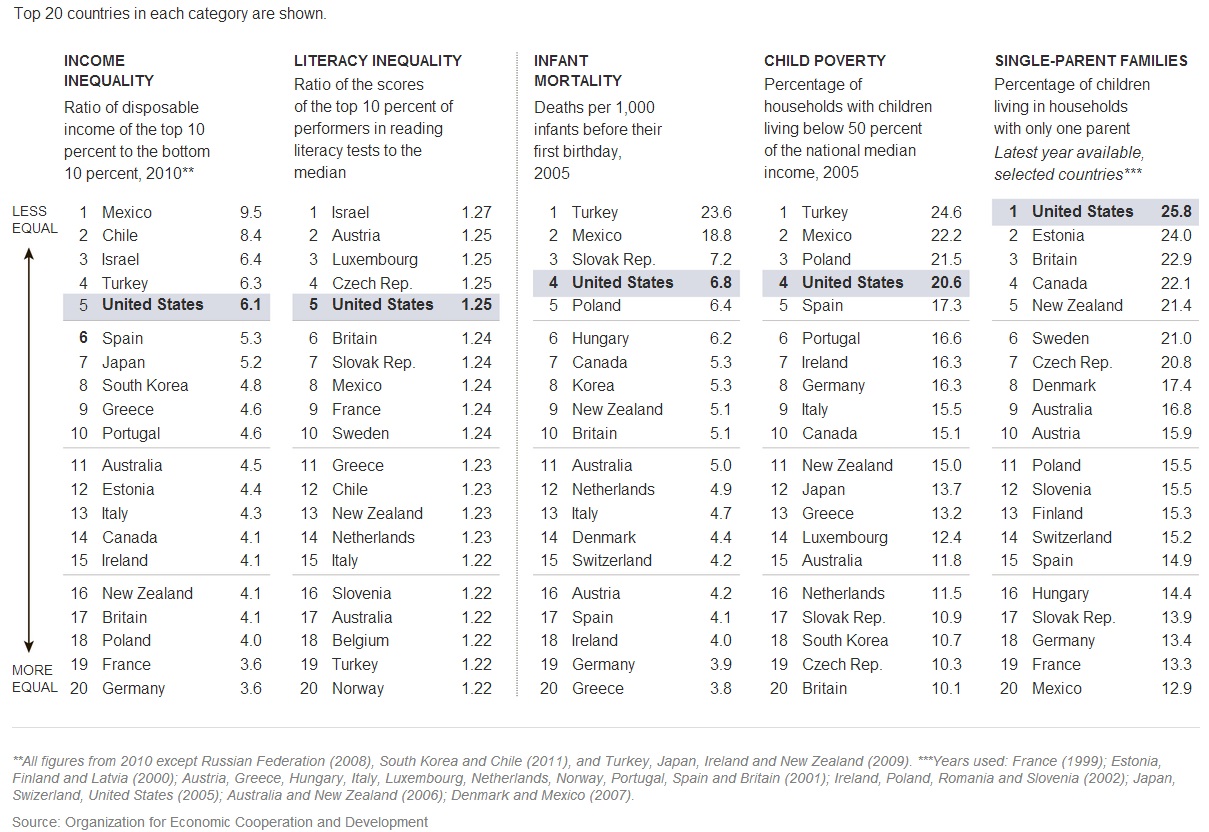
The U.S. compares very poorly to most other Western industrialized nations:
Washington may pay lip service to reducing inequality. But – as we will show below – bad government policy is largely responsible.
The Hard Facts of Inequality
A who's-who's of prominent economists in government and academia have all said that runaway inequality can cause financial crises.
Extreme inequality helped cause the Great Depression, the current financial crisis … and the fall of the Roman Empire.
But inequality in America today is actually twice as bad as in ancient Rome , worse than it was in inTsarist Russia, Gilded Age America, modern Egypt, Tunisia or Yemen, many banana republics in Latin America, and worse than experienced by slaves in 1774 colonial America.
from Carpe Diem:

Posted: 06 Dec 2013 09:03 AM PST Most of the discussion on income inequality focuses on the relative differences over time between low-income and high-income American households, but it's also instructive to analyze the demographic differences among income groups at a given point in time to answer the question: How are high-income households different from low-income households? The chart above (click to enlarge) shows some key demographic characteristics of U.S. households by income quintiles for 2012, using updated data from the Census Bureau (here, here and here, and see my previous versions of this analysis for years 2009 and 2010 and 2011).
1. Mean number of earners per household. On average, there are significantly more income earners per household in the top income quintile households (2.04) than earners per household in the lowest-income households (0.45). It can also be seen that the average number of earners increases for each higher income quintile, demonstrating that one of the main factors in explaining differences in income among U.S. households is the number of earners per household. Also, the unadjusted ratio of average income for the highest to lowest quintile of 15.8 times ($181,905 to $11.490), falls to a ratio of only 3.5 times when comparing "income per earner" of the two quintiles: $89,169 for the top fifth to $25,533 for the bottom fifth.
2. Share of households with no earners. Sixty-one percent of U.S. households in the bottom fifth of Americans by income had no earners for the entire year in 2012. In contrast, only 3% of the households in the top fifth had no earners in 2012, providing more evidence of the strong relationship between household income and income earners per household.
3. Marital status of householders. Married-couple households represent a much greater share of the top income quintile (77.5%) than for the bottom income quintile (17%), and single-parent or single households represented a much greater share of the bottom 20% of households (83.0%) than for the top 20% (22.5%). Like for the average number of earners per household, the share of married-couple households also increases for each higher income quintile.
4. Age of householders. Almost 8 out of every 10 households (79.5%) in the top income quintile included individuals in their prime earning years between the ages of 35-64, compared to fewer than half (47.3%) of household members in the bottom fifth who were in that prime earning age group last year. The share of householders in the prime earning age group of 35-64 year olds increases with each higher income quintile.
Compared to members of the top income quintile of households by income, household members in the bottom income quintile were 1.6 times more likely (23.5% vs. 14.8%) to be in the youngest age group (under 35 years), and more than 5 times more likely (29.2% vs. 5.7%) to be in the oldest age group (65 years and over).
6. Work status of householders. More than four times as many top quintile households included at least one adult who was working full-time in 2012 (78.2%) compared to the bottom income quintile (only 18.2%), and more than five times as many households in the bottom quintile included adults who did not work at all (67.3%) compared to top quintile households whose family members did not work (12.5%). The share of householders working full-time increases at each higher income quintile.
7. Education of householders. Family members of households in the top fifth by income were six times more likely to have a college degree (77.2%) than members of households in the bottom income quintile (only 12.9%). In contrast, householders in the lowest income quintile were 26 times more likely than those in the top income quintile to have less than a high school degree in 2012 (26.7 % vs. 1.0%). As expected, the Census data show that there is a significantly positive relationship between education and income.
Bottom Line: Household demographics, including the average number of earners per household and the marital status, age, and education of householders are all very highly correlated with household income. Specifically, high-income households have a greater average number of income-earners than households in lower-income quintiles, and individuals in high income households are far more likely than individuals in low-income households to be well-educated, married, working full-time, and in their prime earning years. In contrast, individuals in lower-income households are far more likely than their counterparts in higher-income households to be less-educated, working part-time, either very young (under 35 years) or very old (over 65 years), and living in single-parent households. The good news is that the key demographic factors that explain differences in household income are not fixed over our lifetimes and are largely under our control (e.g. staying in school, getting and staying married,etc.), which means that individuals and households are not destined to remain in a single income quintile forever. Fortunately, studies that track people over time indicate that individuals and households move up and down the income quintiles over their lifetimes, as the key demographic variables highlighted above change, see CD posts here, here andhere. And Thomas Sowell pointed out earlier this year in his column "Income Mobility" that:
|
---
from Carpe Diem:
|
|
Posted: 04 Feb 2014 01:22 PM PST
 In a December 2013 CD post, I featured the chart above (click to enlarge) that displays Census Bureau data of various household demographic factors by income quintile in 2012 (education, marital status, average number of earners, percent working full-time, age, etc.) that help us understand the factors that explain differences in household income. In a recent National Review article ("The Working Rich"), Kevin Williamson refers to some similar, slightly older data (from 2011 I think) to make several important points: a) the wealthiest and highest-earning Americans are not "idle rich" but rather work very hard for their money, and b) the poor can learn some lessons from them to become more wealthy themselves. Here's an excerpt:
MP: As I concluded in my December post, household demographics like the average number of earners per household and the marital status, age, and education of householders are all very highly correlated with household income. Specifically, high-income households have a greater average number of income-earners than households in lower-income quintiles, and individuals in high income households are far more likely than individuals in low-income households to be well-educated, married, working full-time, and in their prime earning years. In contrast, individuals in lower-income households are far more likely than their counterparts in higher-income households to be less-educated, working part-time, either very young (under 35 years) or very old (over 65 years), and living in single-parent households. The good news is that the key demographic factors that explain differences in household income are not fixed over our lifetimes and are largely under our control (e.g. staying in school, getting and staying married,etc.), which means that individuals and households are not destined to remain in a single income quintile forever. Fortunately, studies that track people over time indicate that individuals and households move up and down the income quintiles over their lifetimes, as the key demographic variables highlighted above change. And as Kevin points out, if the poor pay attention, they can learn from the rich and become better off themselves by investing in education, getting and staying married, and working full-time. |

No comments:
Post a Comment