Thursday, July 19, 2018

Why disparate impact theory is a bad fit for school discipline | Thomas B. Fordham Institute


In hindsight, this is has an eerily similar footprint to the Clinton Administration's threatening banks to extend home loans in areas they deemed "less credit worthy" which led to the mortgage failure which led to the Great Financial Crisis (GFC).
In 2014, in response to findings that African American students were three times as likely to be suspended as white students, the Obama Administration sent a lengthy “Dear Colleague” letter to school districts nationwide, spelling out a new policy on school discipline, motivated by disparate impact theory. It warned administrators that they could be subject to a federal civil rights investigation if their data showed significant racial disparities in the use of suspensions or expulsions, and could be found guilty of discrimination even if they had race-neutral discipline policies that were being applied even-handedly.
History doesn't repeat, but it sure does rhyme a lot. This one rhymes. The French fought their Revolution for equality, ours was fought for freedom and fairness. It helps to understand the differences in perspective as it shades policy.

We don't differ so much on recognition of the problem, we differ greatly on the proposed solutions and this generally comes from dealing with the problem superficially or solving it based on root cause analysis. We would rather deal with the symptoms than the disease.

from Michael J. Petrilli:

Second, pressuring schools to reduce suspensions without simultaneously helping them do the hard work of developing alternative approaches will have a predictable outcome: disorder and violence will increase, and learning will suffer. Recent studies in Chicago, New York, and Philadelphia are showing signs of this very dynamic. To be sure, it’s because dysfunctional schools and systems are implementing discipline reform poorly, just like they implement so many other initiatives poorly. But to blame “implementation” is a cop-out that ill-serves students. Policies must be designed for the reality of the schools we’ve got, not the utopian schools we wish we had. If mandates are leading to unintended consequences, we need to face them—and fix them.
When we add the federal government to the mix, the situation grows even more complex. For sure, the Department of Education’s Office for Civil Rights should respond to specific complaints of discrimination against students, including when it comes to discipline. That has been a fundamental federal role for decades, and should remain so. The question regarding the 2014 “Dear Colleague” letter on discipline, however, isn’t about acts of discrimination, or about whether Uncle Sam should offer helpful “guidance.” It’s about whether the feds should launch proactive investigations in any school system with racial disparities in its discipline rates. Given that almost every district in the country has such disparities—and that no district wants to be subject to a civil rights investigation, even if later found innocent of discrimination—this policy amounts to an implicit order for systems nationwide to dramatically reduce suspensions of children of color. The impulse behind this policy is understandable, but without a mechanism for providing support in implementation, it is a recipe for unintended consequences nationwide.

from edexcellence.net
https://edexcellence.net/articles/why-disparate-impact-theory-is-a-bad-fit-for-school-discipline

TBFI/Joe Portnoy
Editor’s note: School discipline reform has been the subject of several articles by Fordham’s Mike Petrilli in recent weeks. See this one for an overview of his concerns about the unintended consequences of top-down reform, and this one for ideas on where we might find common ground.
In 2014, in response to findings that African American students were three times as likely to be suspended as white students, the Obama Administration sent a lengthy “Dear Colleague” letter to school districts nationwide, spelling out a new policy on school discipline, motivated by disparate impact theory. It warned administrators that they could be subject to a federal civil rights investigation if their data showed significant racial disparities in the use of suspensions or expulsions, and could be found guilty of discrimination even if they had race-neutral discipline policies that were being applied even-handedly.
It’s this use of disparate impact analysis—and the threat of federal investigations based on discipline disparities alone—that gives many of us on the right such pause, and is why we believe the current administration should rescind or revise the 2014 letter. We worry that it will tie the hands of teachers and school administrators when it comes to maintaining discipline, possibly leading to greater disorder and even violence. We also worry that well-behaved students of color are most likely to suffer from the current approach. And we worry that it rests on a faulty assumption—that any racial disparity in discipline reflects discrimination rather than differences in student behavior.
Disparate impact theory: A little background
The most relevant section of the 2014 “Dear Colleague” letter states:
Schools also violate Federal law when they evenhandedly implement facially neutral policies and practices that, although not adopted with the intent to discriminate, nonetheless have an unjustified effect of discriminating against students on the basis of race. The resulting discriminatory effect is commonly referred to as “disparate impact.”
Disparate impact theory originated in the world of labor law. The classic example comes from firefighting. For decades, many urban fire departments had been the exclusive province of whites, thanks to explicit discrimination against blacks and other people of color. Once civil rights statutes banned such de jure—i.e., legally enforced—discrimination, some fire departments came up with ways to maintain the discriminatory status quo, such as requiring applicants to pass standardized tests before being hired, tests that African American and Latino applicants tended to fail. Agencies and courts turned to disparate impact theory to probe practices like those, which may have been “facially neutral” but were intended to have, and did have, discriminatory effects. Fire departments had to justify their use of such tests as being relevant to the job. If they couldn’t, the tests were deemed unlawful by the courts.
The 2014 letter from the Education and Justice Departments brought a similar approach to bear in the realm of school discipline. When determining whether schools’ policies and practices are having an “adverse impact” on students, the feds would look at:
…instances where students of a particular race, as compared to students of other races, are disproportionately: sanctioned at higher rates; disciplined for specific offenses; subjected to longer sanctions or more severe penalties; removed from the regular school setting to an alternative school setting; or excluded from one or more educational programs or activities.
If policies did result in disproportionality—and thus had an adverse impact on certain groups of students—schools would have to justify them by proving to the Department of Education that their policies were “necessary to meet an important educational goal” and that there’s no “comparatively effective alternative policies or practices” that the schools could use instead.
Does student misbehavior vary by race and socioeconomic status?
The 2014 policy rested on a fundamental assumption: that differences in student behavior were not themselves driving differential rates of suspensions and expulsions. The letter stated that “research suggests that the substantial racial disparities of the kind reflected in the [Civil Rights Data Collection] data are not explained by more frequent or more serious misbehavior by students of color.”
But is that true? It’s virtually impossible for researchers to know because they can’t “see” student misbehavior, only records of disciplinary actions taken in response to misbehavior. (Maybe the ubiquitous use of cameras and the like will change that one day, for better or worse.) It is certainly likely that some of the disparities are being driven by the bias of teachers and principals, implicit or otherwise, as some studies suggest.
Furthermore, recent studies like this one from Arkansas are showing big differences in suspension rates across schools in the same district. It seems probable that some middle and high schools are taking a tougher approach to discipline than others, and some of these schools—“suspension factories” if you will—serve high proportions of children of color. 
Yet just because student behavior doesn’t explain all of the suspension gap, that doesn’t mean it doesn’t explain some of it. And, as I argued a few weeks ago, it’s extremely likely that student behavior does in fact vary across different subgroups—not because of race, but because of the vastly different socioeconomic circumstances that children of different groups are facing. Kids growing up in poverty are more likely to experience trauma, to live without their fathers, to go home to more violent neighborhoods, and to otherwise face all manner of difficult circumstances that make it more likely that they may misbehave at school. As African Americans are three times more likely to grow up in poverty as white students (36 percent versus 12 percent, as of 2015), we would expect to see racial differences in student behavior, just as we see racial differences in achievement—which are not driven by race, but by socioeconomic differences.
How might we test this theory? One way is to look at the relationship between poverty gaps and discipline disparities across a number of districts. If socioeconomic differences are a major force driving discipline disparities, than we would expect to see bigger discipline disparities in districts with bigger socioeconomic disparities—that is, in places where most of the white students are middle class or above and most of the African American students are poor. Likewise, we would see the smallest disparities in districts where everyone is middle class or everyone is poor.
To find out whether that’s the case, my colleague David Griffith took census poverty data from the new Stanford Education Data Archive and crossed it with data on out-of-school suspensions from the Civil Rights Data Collection.
Each dot in figure 1 represents one of the 120 largest school districts in the country, excluding those that have fewer than 1,000 white students or 1,000 African American students.
The graph shows a simple correlation between black-white discipline disparities (the percentage of black students given one or more out-of-school suspensions in 2013–14 divided by the percentage of white students given the same) versus black-white poverty disparities (the percentage of black children between the ages of five and seventeen in the district living below the poverty line divided by the percentage of white children living below the poverty line).
Figure 1: Black-white suspension gap versus the black-white poverty gap
Sure enough there’s a strong relationship between the poverty gap and the suspensions gap, with differences in poverty explaining more than a third of the differences in discipline disparities from district to district. Maybe something else could explain this phenomenon, but it appears likely that poor students misbehave at higher rates than non-poor students, and in some districts poor students are much more likely to be black.
***
Where might we turn to find out whether misbehavior itself varies across different groups? How about the students themselves? One piece of evidence comes from the Centers for Disease Control and its Youth Risk Behavior Surveillance System. In 2015, high school students were asked if they had been in a fight on school property at any time in the past 12 months. African American students were 2.2 times more likely to say yes than white students—11.4 percent to 5.2 percent. (See table 13.2 in this 2016 Department of Education report.)
Or how about lower-level offenses, the type that many discipline reformers want treated without suspensions? According to a 2009 nationally representative survey of ninth grader, 17 percent of African American students reported going to class late “sometimes,” versus 10 percent of white students. And 4.1 percent of black students reported going late to class “often,” versus 2.2 percent of white students. (See table 1.)
Table 1. Percentage distribution of ninth graders who reported going to class late in 2009-10

Never
Rarely
Sometimes
Often
All students
44.2
40.0
12.7
3.2
White
47.2
40.6
10.0
2.2
Black
38.7
40.4
16.8
4.1
Hispanic
41.6
37.9
16.2
4.4
Asian
49.3
38.8
10.5
1.5
American Indian/Pacific Islander
34.0
44.1
15.3
6.6
More than one race
40.4
40.6
14.2
4.8
SOURCE: U.S. Department of Education, National Center for Education Statistics, High School Longitudinal Study of 2009 (HSLS:09), Base Year.
So according to the kids themselves, compared with white students, African American pupils are more than twice as likely to get into fights at school and almost twice as likely to get to class late. These differences are almost surely being driven in large part by socioeconomic factors. (See figure 2.)
Figure 2. Race, class, and student behavior
Is every school system in the country guilty of discrimination?
Imagine that you run a school system with pupil demographics that reflect national averages. Your African American students are three times likelier to live in poverty than your white students, are more than twice as likely to get into fights at school, and almost twice as likely to be chronically tardy to class. According to the 2014 “Dear Colleague” letter, if you suspend African American students at twice the rate of white students, you can be subject to an OCR investigation—even if those suspensions are completely justified by student behavior. Because your policy of suspending students who get into fights on school grounds will be said to have had an “adverse impact” on black students, you will face, at minimum, the negative publicity that comes from a civil rights investigation.
And when federal investigators come knocking, you will have to convince them (and not even an impartial judge) that (a) the suspensions serve an educational purpose and (b) that there’s not a better approach. Otherwise you can be found guilty of discrimination when in fact what you did was treat all kids the same according to their actions.
The message to administrators nationwide is quite clear: Get your discipline data in line, even if that means under-disciplining certain groups of students, or else you can expect a civil rights investigation. This is why many of us don’t think it’s a stretch to say that the 2014 policy imposed racial quotas on discipline and has likely had a chilling effect on discipline nationwide.
***
Though plenty of conservatives disagree, personally I believe that disparate impact theory has a limited but real role to play in ferreting out discrimination in certain domains, including hiring. When a facially neutral policy is intended to have a discriminatory impact, it’s appropriate for the government to put an end to it.
But it’s not a good fit for the complicated issue of school discipline. Here, a great deal of the racial disparities actually stem from differences in actual student behavior, which in turn is related to differences in socioeconomic circumstances. Threatening districts with civil rights investigations may reduce the number of suspensions, especially for children of color, but it may also increase disorder in the classroom by depriving teachers of an effective tool for maintaining order. That only serves to harm the peers of disruptive students, who are most likely to be children of color themselves.
To be sure, it remains essential for students and their families to have the right to file complaints with the Office for Civil Rights if the feel they have been subject to discrimination, and for investigators to examine the facts of their cases and come to appropriate judgments.
But jumping to conclusions from districts’ raw discipline data ought to end. School systems should know that if they are treating students fairly, the federal government will have their backs—even if some groups of students are suspended at higher rates than others.

Wednesday, July 18, 2018

The College Boost: Grads Still Outearn Nongrads | St. Louis Fed


College bonus 1
This is Part I of a three-part series from the Fed. A little more cheery than Part II, which I posted yesterday. I can't wait for Part III to see their solutions.
On average, families headed by someone with a four-year college degree have 69 percent more income and 201 percent more wealth than families without a degree. The gaps between nongrads and those with a postgraduate degree are even larger.
I fear they are going to bang the drums for equal funding for all school districts nationwide. It's all these socialists and Marxists know. They fail to realize and refuse to accept that even if you do that -- and there will be unintended/unforeseen consequences to doing that -- the race will still go to the swiftest and the fight to the strongest. That's the way to bet. 


from the St. Louis Fed:

The College Boost: Grads Still Outearn Nongrads


Monday, July 16, 2018


By William Emmons, Lead Economist; Ana Hernández Kent, Policy Analyst; and Lowell Ricketts, Lead Analyst, Center for Household Financial Stability
This is the first post in a series on the financial returns of college degrees.
A college degree has long been associated with a laundry list of positive outcomes:
  • Higher income and wealth
  • Better health
  • A higher likelihood of being a homeowner
  • A higher likelihood of being partnered (married or cohabitating)
  • A lower risk of falling behind on loan payments
In response, more and more Americans are pursuing—and earning—a bachelor’s degree. In 1989, about 23 percent of families were headed by someone with a four-year college degree or higher. By 2016, the share had reached 34 percent.
More individuals are continuing their schooling beyond the traditional four-year degree as well. Families headed by someone with a postgraduate degree (such as a master’s degree or Ph.D.) rose from almost 9 percent of all families in 1989 to about 13 percent in 2016.
This remarkable surge in highly educated individuals begs the question: How have the financial returns (expected earnings and wealth) of college degrees fared over time?

The Average Financial Returns to a College Degree


Previous work by our Center for Household Financial Stability has long corroborated the traditional wisdom that a college degree is associated with higher expected earnings and wealth.1 For this analysis, we typically used the Survey of Consumer Finances, often considered the gold standard of data on household balance sheets (asset, debt and income).
When evaluating the financial payoff to a college education, it is useful to ask: How much additional income and wealth does a college-educated family have beyond that of a family that doesn’t hold a college degree?

Income Differences


Pooling all available data (47,776 families), we found that the average family with a four-year degree (grads) earned approximately 69 percent more than the average family without a degree (nongrads). The average family with a postgraduate degree (postgrads) earned twice as much as their nongrad counterpart. Importantly, these estimates controlled for the age of the family, so we were comparing outcomes at similar stages of life.

Wealth Differences


What about wealth? College graduates—both grads and postgrads—accumulated much higher amounts of wealth over their lifetime than nongrads. On average, grad families accumulated 201 percent more, while postgrad families accumulated 242 percent more than their nongrad peers.
These boosts are remarkable, and it’s clear why going to college is such an imperative for individuals and families across the U.S. However, these average returns mask a considerably wide range of outcomes. How do these outcomes vary when considering the race and ethnicity as well as birth decade of these families? That will be the focus of the next post in this series.

Notes and References


1 For example, see Emmons, William R.; and Noeth, Bryan J. “Education and Wealth.” The Demographics of Wealth, Essay No. 2, May 2015.

Additional Resources


Seven do's and don't's of school discipline reform | The Thomas B. Fordham Institute

Seven do's and don't's of school discipline reform | The Thomas B. Fordham Institute
It seems likely that the Trump administration will soon revise or rescind an Obama-era directive intended to address racial disparities in school disciplinary actions. The "Dear Colleague" letter in question, issued by the U.S. Departments of Education and Justice in 2014, has been the subject of much debate. It stated that school districts could be investigated and found guilty of violating students' civil rights when doling out punishments, even if the discipline policies were race-neutral and implemented in even-handed ways (in other words, even if there was no evidence of discriminatory treatment of students).

Yet the latest federal discipline data, released earlier this month, show that African American students continue to be disciplined at higher rates than white students. While U.S. Secretary of Education Betsy DeVos held roundtable meetings with lawmakers in April to hear debates about the guidance from both sides, there is no timeline for the administration's final decision.

But school discipline reform did not begin with President Obama, and it won't end with President Trump. Momentum for change has been gaining steam for years, which legislatures and school boards have increasingly codified into laws and practices at state and local levels.

If the Trump administration makes its move to revise or rescind, local education leaders will regain discretion over how to balance discipline with safety and order in the classroom. Regardless of what happens at the federal level, school discipline brings into play a number of important but often competing goals for school districts: eliminating discrimination, protecting the learning time of both disruptive students and their well-behaved peers, upholding high expectations for students, empathizing with traumatized students, and defending the authority of teachers.
---
With those competing values in mind, here are seven suggestions for superintendents and district-level administrators to consider for their discipline policies:

DO worry about racial discrimination and implicit bias when determining punishments for students who misbehave. Advocates for fair school discipline are right to be alarmed by the dramatic racial disparities. Schools nationwide suspended 2.7 million students in 2015–16—100,000 fewer students than 2013–14. But African American male students represented a quarter of all students who received an out-of-school suspension in 2015–16, despite making up only 8 percent of enrollment. Multiple studies have found that educator bias explains some of these disparities.

Furthermore, it is clearly against the law—and has been for half a century—for districts to treat students differently based on their race. Any differential treatment will remain illegal, even if the Trump administration does rescind federal guidance.

DON'T assume that racial bias alone explains disparities in discipline rates. The same studies that find evidence of racial bias in disciplinary actions also find that such bias only explains some of the disparities. Differences in student behavior are also a major factor. That's not because of the race of the students, but because, tragically, different racial groups face different kinds and degrees of trauma, abuse, and deprivation, many of them associated with poverty.

Students themselves even report such differences. On federal surveys, twice as many African American students report getting into fights at school as white students. It would be miraculous if children's vastly different life experiences didn't result in behavioral differences in school.

DO show empathy for kids whose misbehavior is due to difficult life circumstances. Educators need to understand the truly tough circumstances that some children face outside of school and do their best to help them cope. Identifying appropriate mental-health supports is particularly important. Addressing the underlying causes of student misbehavior can go a long way toward nipping it in the bud.

DON'T engage in the soft bigotry of low expectations. It's just as important for empathy not to turn into excuses for behavior that is out of line or compromises students' academic potential. All students need to learn how to control their impulses and behave in acceptable ways, as well as cultivate an attitude that reflects motivation and engagement.

DO find ways to address misbehavior that lead to positive changes and protect opportunities to learn. Long suspensions reduce learning time for those being punished and may not improve their behavior. It's worth trying in-school suspension for nonviolent offenses, with supports for students so they can behave better and continue learning the valuable skills and knowledge that schools exist to teach them.

DON'T just send disruptive kids back to their classrooms. Those who break rules can't be our exclusive concern; their classmates also have the right to learn. We must protect their learning environment to stay on track and close achievement gaps. Research also shows what common sense indicates: One or two disruptive students can erode the learning of an entire classroom. It should alarm us that in 2015–16, 43 percent of educators reported classroom misbehavior that affects their ability to teach students, according to the National Center for Education Statistics.

DO address "suspension factories." A 2013 report by researchers at The Civil Rights Project at UCLA found that thousands of public schools suspend more than a quarter of their students every year. And that is still the case for too many schools today—a sign that they are careening out of control on disciplinary measures. While it's bad to ignore schools with such high rates of suspensions, it's arguably worse to respond by simply commanding that they get their numbers down without providing massive amounts of support.

School discipline presents enormous challenges for education leaders. Getting it right takes balance, judgment, and wisdom. There's not much of that in Washington these days, but thankfully it still exists in abundance across our nation's schools. Let's make our decisions wisely.

As first appeared in Education Week as "7 Suggestions for Better School Discipline"on May 29, 2018. 


Sent from my iPhone

The College Boost: Is the Return on a Degree Fading? | St. Louis Fed

grad change expected income


I'm sure it's not the Feds fault, right?
On average, black college graduates born in the 1980s have little or no additional wealth above their counterparts without a degree. This is true for postgraduate degrees as well.
Get the Fed out of education and watch results go back to where they were before they put their hands on it.

But no!!  We'll continue to ask the arsonists to put out the fire. It appears we've definitely devalued or diminished, but not quite destroyed the value of an education in this country. God Bless America!!


from StLouisFed.org
https://www.stlouisfed.org/on-the-economy/2018/july/college-boost-return-degree-fading

The College Boost: Is the Return on a Degree Fading?


Tuesday, July 17, 2018

This is the second post in a series on the financial returns of college degrees.
By William Emmons, Lead Economist; Ana Hernández Kent, Policy Analyst; and Lowell Ricketts, Lead Analyst, Center for Household Financial Stability
Our May research symposium, “Is College Still Worth It: Looking Back and Looking Ahead,” identified how the returns to a college degree have changed over time and how those returns can be boosted going forward.
For our Center’s research contribution, we focused on how the financial returns to college have changed across generations. We concentrated on income and wealth outcomes for college graduates born in six decades:1
  • 1930s
  • 1940s
  • 1950s
  • 1960s
  • 1970s
  • 1980s
Among racial and ethnic groups, we had a large enough sample to break out our results for non-Hispanic white families and African-American or black families. Similar to the first post in this series, we looked at the boost to income and wealth associated with both four-year (grads) and postgraduate (postgrads) college degrees.

Expected Boost to Income Remains Strong

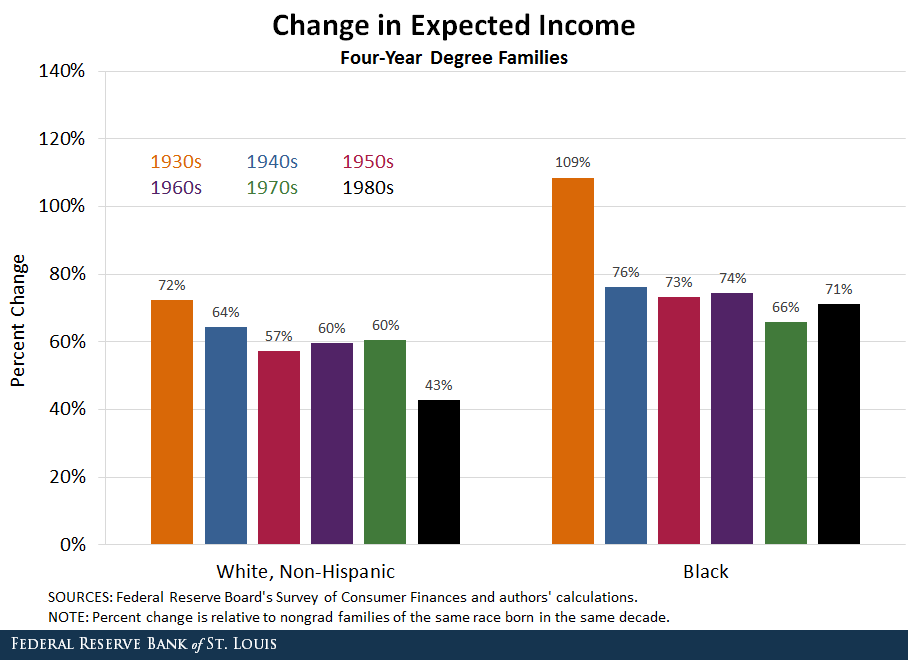
The figure below shows that expected incomes among grad families of either race have largely held steady across birth cohorts, with the exception of white grads born in the 1980s.
change expected income
Certainly, the returns were highest among older generations. By our measure, the 1930s generation benefited marvelously from earning a four-year degree. Incomes of grads born in the ‘30s were 72 percent and 109 percent higher than their nongrad peers for white and black families, respectively.
However, given statistical uncertainty or “noise,” we can’t definitively say that the incomes of grads born in the ‘30s were meaningfully higher than grads born in the ‘40s through ‘70s. This tells us that the expected boost to earnings associated with a four-year degree remains largely unchanged over time.
We can say that for white grads born in the ‘80s, their incomes were meaningfully lower than those of previous generations. However, it’s important to note that even the ‘80s grads received a sizable boost to their income. Thus, it appears that grad families of either race, born in any decade, reaped sizable rewards in the labor market.
What about postgraduate degrees? The next figure offers a similar look at the income boost among these highly educated families.
grad change expected income
Expected earnings associated with a postgraduate degree have declined somewhat over time among white families. Returns peaked at 108 percent higher income for postgrad families born in the '30s and gradually shifted down to 54 percent for the postgrads born in the '80s.
Among black postgrads, the earnings boost is considerably more volatile across generations. After looking at the statistical noise related to these estimates, we can’t say that the boost to black postgrad income has meaningfully changed over time.
Again, the '80s are a peculiar decade: Similar to their four-year degree counterparts, white postgrads born in the '80s have a lowest income boost than those born in the previous five decades.

The Wealth Advantage Is Falling

The majority of conversations involving the return to a college degree talk about what graduates earn in the job market following school. This is certainly important, and the evidence suggests that graduates continue to have superior incomes over their lifetime.
What is often obscured is how those graduates accumulate wealth over their lifetime. This is an important difference: Research has shown that assets—financial (such as stocks) and nonfinancial (such as a home)—are profoundly important for both financial security and upward mobility.
If wealth is so important, why is it left out of the conversation? Reliable and nationally representative household balance sheet data are notoriously hard to come by. It is precisely this reason that the Federal Reserve Board’s Survey of Consumer Finances (SCF) is such a valuable resource. Using SCF data, we found that the boost to wealth accumulation associated with college has fallen across generations.
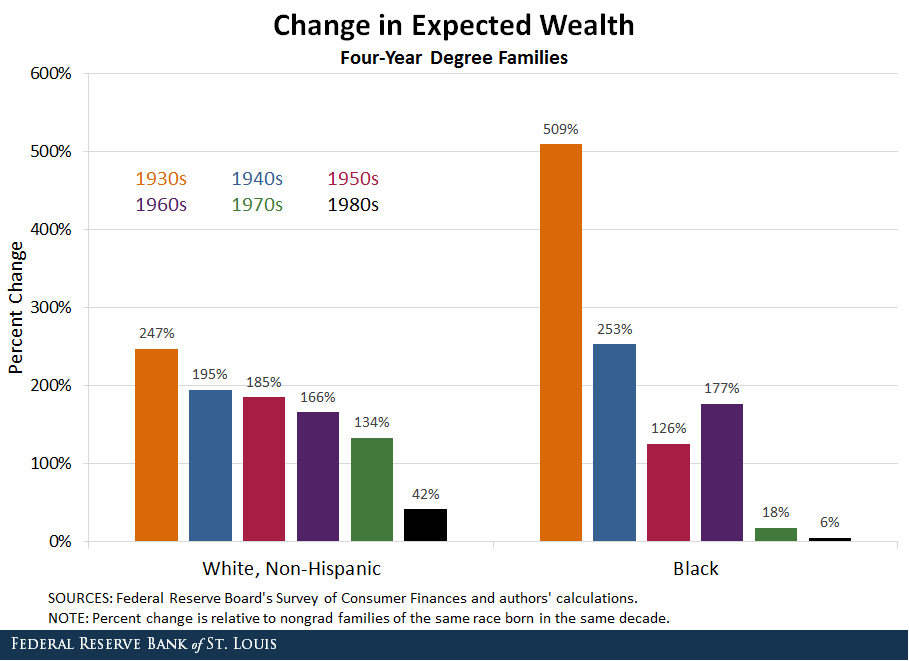
The wealth advantages afforded grad families, white and black, are shown in the figure below.
change expected wealth
A similar trend emerges: Grad families born in previous generations received a much greater boost to wealth accumulation than their nongrad peers. White and black grads born in the ‘30s accumulated 247 percent and 509 percent more wealth, respectively. This compares with 42 percent and 6 percent more wealth for white and black grads born in the ‘80s.
Black graduates born in the ‘70s also accumulated on average a historically low amount of wealth (18 percent) above their nongrad peers. Disturbingly, given the statistical uncertainty around our estimate for the wealth boost among black grads born in the ‘70s and ‘80s, we can’t say for certain that there even is a wealth advantage to a college degree for the average black family.
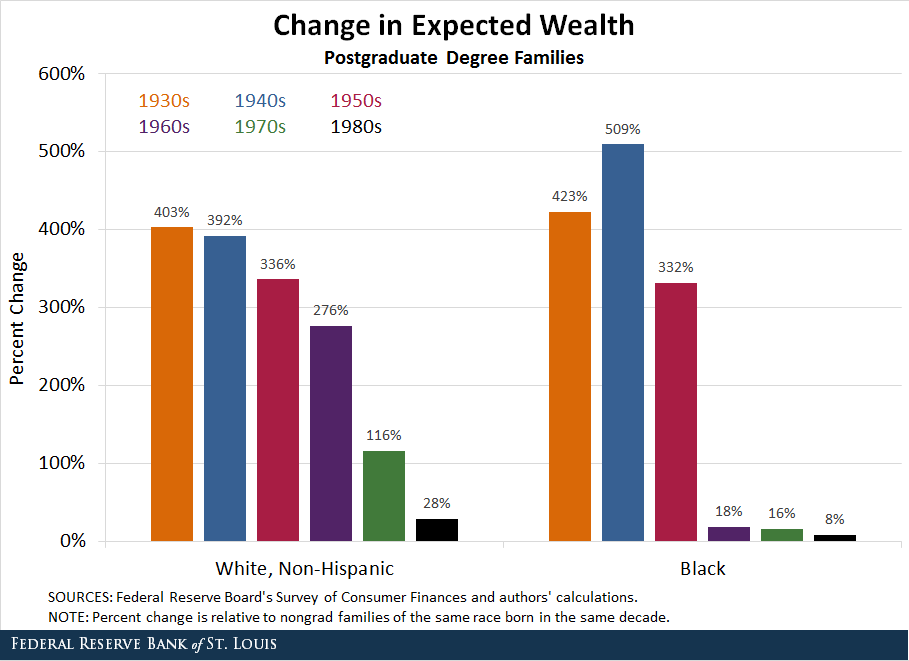
The fortunes of families holding postgraduate degrees are even dimmer by our estimates, as seen in our next figure.
grad change expected wealth
The enormous expected boost to wealth deteriorates rapidly between the ‘50s and ‘80s generations. Among white postgrads, the wealth boost ranged between 403 percent and 276 percent for postgrads born in the ‘30s through ‘60s.
Compare that with those born in the ‘70s and ‘80s, which had 116 percent and 28 percent higher expected wealth than nongrads. The boost estimated for white grads born in the ‘80s is almost negligible after accounting for statistical noise.
The picture is similar for black postgrads, although the decline in the wealth boost starts among postgrads born in the ‘60s. Black postgrads born in the ‘50s accumulated 332 percent more than their nongrad peers. Postgrads born in the ‘60s, ‘70s, and ‘80s accumulated only 18 percent, 16 percent and 8 percent, respectively, more than their nongrad peers.
All of those estimates were sufficiently noisy that we can’t rule out that they could be zero or even negative. The implication is shocking: Black postgrads born in the 1960s, ‘70 or ‘80s do not have statistically higher wealth than blacks who didn’t graduate from college.
Why have the wealth returns to both a four-year and postgraduate degree fallen so precipitously across birth cohorts while earnings have fared far better? The third and final post in this series will offer some potential explanations.

Notes and References

1 Our sample was too thin among families born before the 1930s and after the 1980s to provide reliable estimates.


Monday, July 16, 2018

Tim Tebow Appears At 2018 Eastern League Double-A All-Star Game, Dismisses Mets Promotion Talk

Tim_Tebow_MarkBrownGetty.jpg

Image result for tim tebow michael jordan

** PUBLISHED POST #2,500 *** 

JACKSONVILLE - The stats bear it out. Tebow has done better in most categories with his opportunity than MJ. Russell Wilson would probably have been the better prospect long term had he chosen baseball, but he didn't. He's doing OK in his chosen profession however.

Look out NY. As predicted, the Mets are scraping the cellar and will be out of contention by September. That can only mean a call-up for Tim Tebow. The icing on the cake would be a MLB HR in his first AB.

from baseballamerica.com
https://www.baseballamerica.com/stories/tim-tebow-adjusts-to-double-a/

Tebow batted ninth as the DH for the Eastern Division in Wednesday's Eastern League all-star game and went 1-for-4 with an opposite-field double. He had a chance to give his team the lead in the seventh inning, but with runners on first and second and one out he popped out to left on the first pitch.
Prior to the game, hundreds of fans waited close to an hour for his autograph. His No. 15 shirt was the only all-star player jersey available for sale at the game.
The Heisman Trophy-winning quarterback turned baseball player is hitting .241/.319/.362 in 76 games for the Binghamton Rumble Ponies. He’s smacked five home runs with 33 RBIs.
Tebow has committed just one error in 75 chances in left field.
He’s been on a bit of a tear heading into Wednesday’s game. In his previous 10 games, Tebow is hitting .353 (12-for-34).

Sent from my iPhone

NEW SURVEY: Vast majority of students want due process rights that colleges refuse to provide

Image result for students want due process rights
JACKSONVILLE - That's right, it's all Betsy Devos' fault. Not the Comrade and his Dear Colleague letters and respect for the Constitution. Dear Colleague: End Disaprate Impact based policies. 

What a concept! "Innocent until proven guilty" And yet in that bastion of human rights - the college campus - they ain't getting it. Until a conservative comes in and tries to fix it.

  •  85 percent of students think their accused classmates should be considered innocent until proven guilty. According to last year's due process report, however, less than 30 percent of America's top universities guarantee students that protection. 

Where's the outrage? Where's the protests? Where's the sit-ins, the defecating on cars?

C'mon college students!! You're better than that.

And c'mon college administrators and activists!! We know you're not better than that, but c'mon.


FIRE

A new survey from the Foundation for Individual Rights in Education finds that a vast majority of college students support fundamental due process protections in campus disciplinary hearings in order to ensure they are fair. Most top college and universities, however, fail to provide them.


FPO
  • 85 percent of respondents think students accused of misconduct should be considered innocent until proven guilty, but only 30 percent of top schools guarantee this vital protection.
  • 8 in 10 students surveyed think students accused of breaking the law should be allowed to have a lawyer help defend them in campus disciplinary proceedings, but only three top colleges allow it.
  • Colleges argue that due process can be minimal because hearings are merely "educational." Students overwhelmingly disagree, with 84 percent responding that the primary purpose of a campus disciplinary hearing is to provide justice and protection to students on campus.
PHILADELPHIA, June 13, 2018 — A new survey from the Foundation for Individual Rights in Education finds that a vast majority of college students support fundamental due process protections in campus disciplinary hearings in order to ensure they are fair. Most top college and universities, however, fail to provide them. 
The survey of student attitudes builds on FIRE's "Spotlight on Due Process" report, released last year, which found that the overwhelming majority of America's top universities fail to provide students accused of serious misconduct with even the most basic elements of fair procedure. 
FIRE's new survey, "Proceeding Accordingly: What Students Think about Due Process on Campus," found that 85 percent of students think their accused classmates should be considered innocent until proven guilty. According to last year's due process report, however, less than 30 percent of America's top universities guarantee students that protection. Similarly, 8 in 10 students surveyed think students accused of breaking the law should be allowed to have a lawyer in campus disciplinary proceedings, but very few top colleges and universities allow active assistance from an attorney.
"There's a vast gulf between the robust protections that students want and to which they are morally entitled, and the meager protections that most colleges actually provide," said Samantha Harris, FIRE's vice president of policy research. "Campus proceedings can have permanent, life-altering consequences. It's time for colleges and universities to start listening to their students and providing safeguards that reflect the seriousness of these processes."
The survey measures student support for due process protections in three scenarios: when a student allegedly breaks a rule, drinks alcohol under the age of 21, and engages in sexual misconduct. Support for protections under each scenario varies by gender and political affiliation.
Key findings include:
  • 98 percent of students think it is very important or important that students have due process protections in campus judicial proceedings.
  • Female students are eight percentage points less likely to think a student should be considered innocent by the school's administration if the student has allegedly engaged in sexual misconduct than if the student has allegedly broken an unspecified rule.
  • Only 16 percent of students think that the primary purpose of a campus disciplinary hearing is to provide an educational experience for those involved, while 84 percent of students think that the primary purpose of a campus disciplinary hearing is to provide justice and protection to students on campus.
  • More than 80 percent of students responded that an adviser should be allowed to help defend students during campus disciplinary proceedings.
  • Although three-quarters of students support cross-examination in campus disciplinary proceedings, only one-third of institutions in FIRE's "Spotlight on Due Process" report consistently provide students a meaningful opportunity to cross-examine witnesses.
  • When a student has allegedly engaged in sexual misconduct, very liberal students are 19 percentage points less likely than their very conservative peers to think that those students should be considered innocent until proven guilty by the school's administration.
  • However, when a student has allegedly engaged in underage drinking, very liberal students are 13 percentage points more likely than their very conservative peers to think that students should be considered to be innocent until proven guilty by the school's administration.
For this survey, FIRE contracted with YouGov (California), a well-regarded nonpartisan polling and research firm. YouGov used an online survey to interview two- and four-year undergraduate students at American colleges and universities between Jan. 29, 2018 and Feb. 12, 2018, and provided FIRE with a final data set of 2,225 responses.
YouGov has polled for The New York Times and The Economist. The Pew Research Center finds that YouGov outperforms its competitors when it comes to providing accurate survey results. A copy of the full report and methodology, an FAQ, and the toplines and tabulations from YouGov can be accessed on FIRE's website.
The survey project was made possible by a grant from the John Templeton Foundation to conduct polling on campus attitudes, engage in legal and social science research, and mobilize a wider audience on and off campus in the fight for student and faculty rights.
The Foundation for Individual Rights in Education (FIRE) is a nonpartisan, nonprofit organization dedicated to defending liberty, freedom of speech, due process, academic freedom, legal equality, and freedom of conscience on America's college campuses.
CONTACT
William Rickards, Communications Coordinator, FIRE
215-717-3473; media@thefire.org
Foundation for Individual Rights in Education (FIRE)
510 Walnut Street | Suite 1250 | Philadelphia, PA 19106
Unsubscribe   |   View this email in your browser

Giants Top Minor League Prospects

  • 1. Joey Bart 6-2, 215 C Power arm and a power bat, playing a premium defensive position. Good catch and throw skills.
  • 2. Heliot Ramos 6-2, 185 OF Potential high-ceiling player the Giants have been looking for. Great bat speed, early returns were impressive.
  • 3. Chris Shaw 6-3. 230 1B Lefty power bat, limited defensively to 1B, Matt Adams comp?
  • 4. Tyler Beede 6-4, 215 RHP from Vanderbilt projects as top of the rotation starter when he works out his command/control issues. When he misses, he misses by a bunch.
  • 5. Stephen Duggar 6-1, 170 CF Another toolsy, under-achieving OF in the Gary Brown mold, hoping for better results.
  • 6. Sandro Fabian 6-0, 180 OF Dominican signee from 2014, shows some pop in his bat. Below average arm and lack of speed should push him towards LF.
  • 7. Aramis Garcia 6-2, 220 C from Florida INTL projects as a good bat behind the dish with enough defensive skill to play there long-term
  • 8. Heath Quinn 6-2, 190 OF Strong hitter, makes contact with improving approach at the plate. Returns from hamate bone injury.
  • 9. Garrett Williams 6-1, 205 LHP Former Oklahoma standout, Giants prototype, low-ceiling, high-floor prospect.
  • 10. Shaun Anderson 6-4, 225 RHP Large frame, 3.36 K/BB rate. Can start or relieve
  • 11. Jacob Gonzalez 6-3, 190 3B Good pedigree, impressive bat for HS prospect.
  • 12. Seth Corry 6-2 195 LHP Highly regard HS pick. Was mentioned as possible chip in high profile trades.
  • 13. C.J. Hinojosa 5-10, 175 SS Scrappy IF prospect in the mold of Kelby Tomlinson, just gets it done.
  • 14. Garett Cave 6-4, 200 RHP He misses a lot of bats and at times, the plate. 13 K/9 an 5 B/9. Wild thing.

2019 MLB Draft - Top HS Draft Prospects

  • 1. Bobby Witt, Jr. 6-1,185 SS Colleyville Heritage HS (TX) Oklahoma commit. Outstanding defensive SS who can hit. 6.4 speed in 60 yd. Touched 97 on mound. Son of former major leaguer. Five tool potential.
  • 2. Riley Greene 6-2, 190 OF Haggerty HS (FL) Florida commit.Best HS hitting prospect. LH bat with good eye, plate discipline and developing power.
  • 3. C.J. Abrams 6-2, 180 SS Blessed Trinity HS (GA) High-ceiling athlete. 70 speed with plus arm. Hitting needs to develop as he matures. Alabama commit.
  • 4. Reece Hinds 6-4, 210 SS Niceville HS (FL) Power bat, committed to LSU. Plus arm, solid enough bat to move to 3B down the road. 98MPH arm.
  • 5. Daniel Espino 6-3, 200 RHP Georgia Premier Academy (GA) LSU commit. Touches 98 on FB with wipe out SL.

2019 MLB Draft - Top College Draft Prospects

  • 1. Adley Rutschman C Oregon State Plus defender with great arm. Excellent receiver plus a switch hitter with some pop in the bat.
  • 2. Shea Langliers C Baylor Excelent throw and catch skills with good pop time. Quick bat, uses all fields approach with some pop.
  • 3. Zack Thompson 6-2 LHP Kentucky Missed time with an elbow issue. FB up to 95 with plenty of secondary stuff.
  • 4. Matt Wallner 6-5 OF Southern Miss Run producing bat plus mid to upper 90's FB closer. Power bat from the left side, athletic for size.
  • 5. Nick Lodolo LHP TCU Tall LHP, 95MPH FB and solid breaking stuff.