Tuesday, February 25, 2020

The Sixth Tool: Training Baseball Pitch Recognition - MIT Sloan Analytics Conference

Image result for The Sixth Tool: Training Baseball Pitch Recognition - MIT Sloan Analytics Conference

If you have not stumbled upon this as a resources, and I mean both the podcast and the slide presentation from MIT Sloan, you will be better off for the experience. Dr. Fadde is a great player development resource. And if MIT Sloan doesn't impress you, there's not much more I can do to help. Enjoy!!

Subject: The Sixth Tool: Training Baseball Pitch Recognition - MIT Sloan Analytics Conference

Pitch Recognition:The Sixth Tool - Peter J. Fadde, Ph.D.
from sloansportsconference.com
 http://www.sloansportsconference.com/content/the-sixth-tool-training-baseball-pitch-recognition/
The skill of pitch recognition, measured with metrics such as 0-Swing%, Line Drive %, and BB/K ratio, is so important that it's become a virtual sixth tool in baseball. But it's generally considered to be more a talent than a learned skill … and therefore not trainable. This talk describes and demonstrates a new approach that adapts the video-occlusion method developed in sport science research laboratories in order to both test and train this elusive perceptual-cognitive skill. Running on a laptop computer, video-occlusion can be used to measure the pitch recognition ability of prospects, diagnose pitch recognition problems, and systematically develop pitch recognition skill in high-performance baseball batters.
To see presentation slides click here
Sent from my iPhone

Monday, February 24, 2020

WEEK TWO: One flew over the BirdsofStray's Nest (TOTO) this weekend..

Image result for cuckoo's nest

JACKSONVILLE, FL - This is what it felt like watching the series against Rutgers against TOTO @ the BirdsofStray's Nest in Jacksonville. When you go against a team that ended last year NCAA RPI ranked  191 versus our own 106, at home, a 2-1 split is not unreasonable to assume.

Rutgers was also 0-15 versus Quadrants 1-2 last year (versus UNF 7-11) and 5-24 if you add Quad 3 teams (versus UNF 14-15). Making up that sort of a differential, with a lineup that was laden with sophomores was very impressive, if somewhat painful, to watch.

Last week we may have assumed too much from facing VMI, where a 3-0 sweep expectation dissolved into a shaky 2-1 split reality. OK, so was I worried about this series, no! Did I expect what happened this weekend, no!

So, what do we know? Given that we have been off base on our expectations versus reality. Well, I do know this, and we hear it every game that a certain catcher plays, we just don't hear enough of it.

When the levee breaks.....


If it keeps on rainin', levee's goin' to break...
When the levee breaks, I'll have no place to stay....
Don't it make you feel bad... When you're tryin' to find your way home... You don't know which way to go?...
Cryin' won't help you prayin' won't do you no good...
When the levee breaks, mama, you got to move....

....mama, you got to move....That makes so much sense, more than doing the same thing over and over and expecting different results. That's cuckoo, man!!

So, where do we stand? Let's dig into the numbers a bit. Based on our old friend, the RC formula (OBA*SPct*PA), we have UNF @ 5.01 runs expected versus Opponents @ 5.98. Actual Runs come in at 4.17 for UNF (17% below expected) and 8.00 for Opponents (33% over expected).

What gives? Is the formula wacked? In the short-term, it's going to be volatile. In the long-term, it's very reliable.

What could be skewing the data? Where are the most obvious glaring disparities between us-them?

Data Point         UNF      Opponents
Errors                    10                4
Unearned Runs      10                4

Stolen Bases           2                 6
Wild Pitches          12                2?

     K%                        20%             15%
     BB%                      6%               10%
Avg. RISP             ??                 ??

I don't know what the Average with Runner in Scoring Position (RISP) numbers are, but I imagine we fell short in that category as well. RISP is a poor-man's proxy for clutch-hitting.

Clutch hitting, which most believing SABR-metrician's still believe DOES NOT exist, sure threw it's weight around in this series, and I believe it begins with the plate discipline #'s (K%, BB% and hitting approach) all of which Rutgers hitters displayed often this weekend.

The data points above cover pretty much all aspects of the game, offense, defense and special teams.

If you add the errors, stolen bases and wild pitches to the RC formula as an additional OB (I don't know what the exact weighting would be for these events so approximate),for opponents you move the Opponents Runs Expected to 6.70. The rest of the disparity likely resides in the elusive clutch-hitting metric (RISP).

The plate discipline disparity is reflected somewhat in the OBA components of RC formula and displays itself on both the offensive and defensive side of the ball. For that reason, I still feel that focusing on the "process" side of the ball rather than the "results" side. Which dovetails to my last point for this week...

From last week's missive, we identified that the three JUCO transfers posted a 2-25. This weekend, 3-21. We've seen this movie last year somewhat with guys named Maberry, Marabell and Hurwitz. To my memory, only Hurwitz came out of the gate banging, and he was platooned with Clark. That's one of the reasons that every time the 2020 JUCO's told me there was no difference between D1 and JUCO, I was wary.

Of course, you want players to believe that and play accordingly. If you look at the complete season stats from 2019, you wouldn't have guessed that they struggled out of the gate.
If they don't let the numbers get into their head, and maybe squeeze the bat a little less tight, things will happen. Hits fall in bunches too, sometimes. That's baseball.

Some good things happened over the weekend:
  • The 'Strays SWOOPLife Live baseball commentator Drew McDonald and I were discussing the series before the game and Drew mentioned that Eddie Miller had not pitched yet in the series and if a save opportunity did not present itself he might not go until Tuesday against South Carolina. I had hoped that they stretched him out more innings over the course of the season for Eddie's future baseball playing prospects. He pitched 48 innings last year with the departed Trace Norkus picking up 34 IP in some high-leverage spots. I think he needs to pitch at least 1.0 innings per game played, which would be at least 57 IP for the season. As it turned out, they stretched him out four innings Sunday.  A hybrid, non-traditional closer role might be good, and Miller did not look like he would shy away from an enhanced workload.
  • Tucker Horsley's HR was a bolt of lightning. We need another RH power bat in the lineup and if he can deliver it, either from behind the dish or 1B, so be it. He looked good behind the dish on scout day and pre-season. I know that's different from game-speed, but the bat spoke, good and loud.
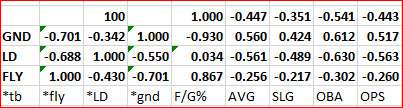
  • It's amazing how many runs can be scored without hearing the term "launch-angle". Rutgers demonstrated that and put a couple of balls over the fence. If some of these modern hitters would push away from YouTube or the Twitter-hitter debates they might realize that last years UNF team demonstrated a negative correlation between FB and OPS and a positive correlation between GB and OPS. I can increase the sample size  but a couple of studies have demonstrated and MLB scouts will tell you that the reason it is hard to scout hitters is that works at the college level is fundamentally different than what works for MLB hitters. But that's not what we're feeding kids today -- solid fundamentals -- were feeding them marketing gimmickry disguised as knowledge.


What to watch out for:
  • Rutgers became the first non-conference opponent to come in and sweep North Florida at Harmon Stadium since Hartford in Feb. 2016.

Listern to: Ken Pomeroy on College Basketball Analytics


I love kenpom.com website, I have a subscription, so I was eager to hear how he went from meterology (another one!) to data analytics and sports. His site is now my go-to for NCAA college basketball analysis.

I won't be a show-spoiler by giving the answers, it's a solid podcast for numbers crunchers and/or sports junkies. You don't have to be anchored to a favorite sport to get valuable insights.

from the powerrank.com
https://thepowerrank.com/2020/02/20/podcast-ken-pomeroy-on-college-basketball-analytics/

On this episode of The Football Analytics Show, I’m joined by Ken Pomeroy, college basketball analytics guru. In addition to his site kenpom.com, his work has been featured on The Athletic, ESPN and Deadspin.

Among other topics, we discuss:
  • How his college basketball rankings and predictions work (2:48)
  • The surprising statistic he uses to calculate home court for each team – no, it’s not points (6:15)
  • Ken’s favorite study among all that he has done on college basketball analytics (11:06)
  • Is the pack line defense of Tony Bennett and Virginia behind the times? (13:39)
  • Can a mid-major like Dayton or San Diego State win the tournament? (15:46)
  • Can Michigan State make a run in this tournament? (17:43)
  • The two numbers to look at to determine whether a player is over or underperforming his skill as a 3 point shooter (20:32)
  • The conference that has befuddled his numbers the most (22:29)
  • I ended the show by asking my usual question about what you would bring if you were kidnapped for a year. This led to a fascinating conversation on our society (25:26).


To listen here, click on the right pointing triangle.

Monday, February 17, 2020

WEEK ONE: Tough Weekend for the BirdsofStray...: and me (TOTO Edition)

Image result for unf baseball

JACKSONVILLE, FL - It could have been worse. Maybe a walk-off balk call from walking away from the series 1-2 instead of 2-1 (It was a balk!! Watch the replay, he flexes the back knee twice, plus other balky moves prior.) The week starts with projections, prognostications and watch-lists, so that's as good a place as any to start. I agree with the "best news" analysis from Baseball America about Eddie Miller.

from Baseball America:
https://www.baseballamerica.com/stories/2020-atlantic-sun-conference-college-baseball-preview/
The best news on the mound for UNF is the return of closer Eddie Miller (1.31, 8 saves), who set the single-season ERA record for the program with his performance last year. The return of catcher Tanner Clark (.306/.407/.398), who was an effective part of the lineup in a limited role last season, will help, but UNF’s offensive success will likely be closely tied to the success of power-hitting junior college transfers in first baseman Trey Spratling-Williams and third baseman Ricky Presno.
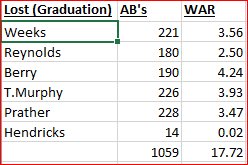
I also agree with the assessment of Tanner Clark and the afterthought about the infusion of talent from the JUCO ranks, but first let's flesh out the analysis from graduation of last year. The Birds of Stray lost five productive mainstays from last year lineup due to graduation.


Gory Math details:
Based on their OBA/SPct and # of AB's these five hitters produced almost 18 Wins above Replacement (WAR). Replacement being the "next man up" or next best available bat after the first nine starters (since we DH). WAR is calculated by multiplying (OBA * Slugging Pct * # AB's) to come up with Runs Created attributable to that players production. Approximately 9 Runs Created equals 1 Win, so RC / 9 = WAR. You can adjust each hitters raw RC (and therefore WAR) by adjusting AB's to 200. 
So, losing Wesley Weeks, Alex Reynolds, Chris Berry, Tanner Murphy and Jay Prather sets the 2020 Ospreys back about 18 wins, but creates the opportunity of about 1,050 AB's or five new lineup slots open to competition.


Presumably, returning upperclassmen from the prior year scarf up the spots. But five is a lot of slots. The best RC or WAR values from returning players are shown above and after adjustment to 200 AB's, we see what appears to be 14 of the 18 wins coming back except for two things. Maberry is gone to parts unknown, for reasons unknown, taking 3.60 WAR and a productive RH bat with him. The 3.60 WAR gets replaced, but at ~ 1.95 replacement level. So now, we're down 5.65 because of some stupid childish shit or a lack of leadership. Self-inflicted wounds are the worst.

But wait, there's more.

As Baseball America alludes to, Tanner Clark blah, blah, blah "in a limited role"  presumably with Hurwitz, also a C, also a LH hitter, so it's not a pure platoon role that limited him. I'm not sure they aren't questioning why one can't DH while the other C's so you can share the catching workload while not losing a productive bat. Don't know what other factors might be in play, but in a perfect world they both get 200 AB's in a season rather than 200 in total. Doubling both of their AB's this year would recapture about 3 of those lost wins. That's a simple lineup optimization fix. Once again, avoid self-inflicted wounds, your opponent will make enough of them for you.

So, five lineup openings, Marabell and May plus either Clark/Hurwitz or Clark and Hurwitz, gives you at worst two, maybe only one JUCO that must step forward and produce. More AB's flowing to Hurwitz and Clark starts to tip the lineup a bit to the left side. Given that the three most prominent JUCO hitters (Presno, Spratling-Williams and West) are also LH poses a bit of a lefty-righty dilemma.

Given that a) runs will be harder to come by this year versus last and b) it's hard to see too many instances of subbing for defense, it seems that lineup optimization to squeeze out as many runs as possible is Priority 1 ahead of platooning or defensive substitutions.

Last years team missed Win Expectation by 2.50 Wins last year based on the RC formula from above and applying the Pytagorean Theorem for Baseball to calculate Wins Expected. The difference there could arise from a couple of blowouts skewing the data or optimizing your lineup to produce the most runs possible.


If we assume that the pitching staff holds opponents to roughly the same numbers (ceteris paribus) as last year, which is not unrealistic, We get the following numbers as far as RC -> opponents RC -> Est. Win Pct -> Est. Wins. We did lose quite a bit of talent on the pitching side, but the returning pipeline of talent seems to be there to replace the graduates.


Pitching has some runway to regress back to 2019 numbers while hitters will have to improve into the teeth of opposition pitching that gets tougher as the schedule gets longer. Same is true for the pitchers about batters faced, but they have some breathing room for now. I thought we would fatten up the hitting statistics in this series, but that's in the past. If the staff can hold the fort on their side, especially early in the season, the hitters don't have to do as much early and the talent has time to acclimate.

And yes Virginia, there is a difference between JUCO and D1 Baseball. If you don't believe me see Jeff Zimmerman's FanGraphs article from 6/28/2016 on the subject where he found that transitions from JUCO to D1 averaged:

-.063 AVG,  -.057 OPB,  -.067 SLG, K's +4.5% of ABs and BB% -0.6% of AB's

Those numbers would be acceptable off a weekend where our JUCO hitters posted two hits in 25 AB's. It's still early and anybody can be almost anything over the course of 40 AB's, even in the major leagues. You need to see where everyone stands after 400 AB's.


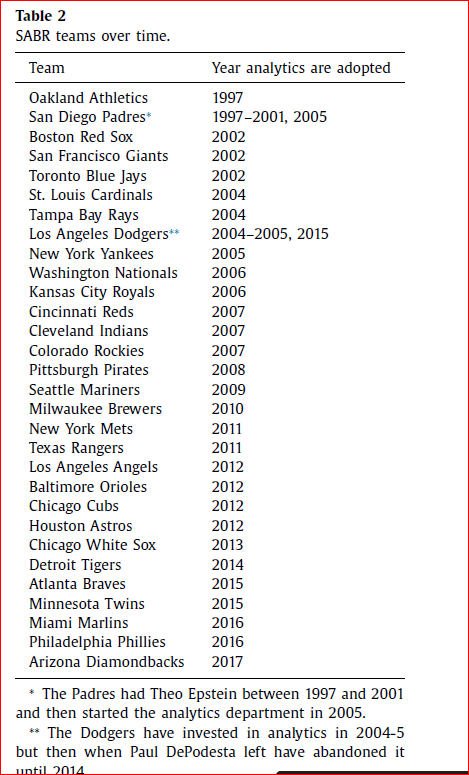
MLB Wins over Expected Wins pre and post adoption of Moneyball

MLB Wins over Expected Wins pre and post adoption of Moneyball


from Data analytics effects in major league baseball - Dr. Ramy Elitzur


Wednesday, November 13, 2019

The 7 Laws of Training According to Dr. Fred Hatfield | Breaking Muscle

dr fred hatfield, fred hatfield, dr squat, powerlifting, strength training

The 7 Laws of Training According to Dr. Fred Hatfield

I recently sat down with Dr. Fred Hatfield, also known as Dr. Squat, to discuss his views on strength and conditioning and how they fit into modern training systems. For those of you unfamiliar, Dr. Hatfield was a great college gymnast and bodybuilder (he was Mr. Mid America, but he didn't compete in the Mr. America competition because of a powerlifting meet).
Dr. Hatfield is probably best known for his world record squat of 1,014lbs set in 1987 when he was the age of 45. He was also the founder of Men's Fitness magazine and the International Sports Sciences Association, and he has written over sixty books. He knows squat and a whole lot more.


The 7 Laws of Training

Dr. Hatfield combed through a great deal of research to best improve his training. Here is what he had to say about seven common laws he found in successful training programs:
If something is called a law then it's called a law for a reason. It means that you've just got to follow the law. If you break the law you go to jail or whatever; or you pay the consequences.
Many years ago, twenty-five or thirty years ago, people began to write about training a lot more than they had in the past, and I'm saying to myself how am I going to judge whether this training program is any good? I scoured the research literature and all of the popular literature for some kind of a yardstick to use to judge the efficacy of these training programs, because Lord knows I didn't have the time or the energy to go on all of those programs.
In reading the works of many sports scientists, Hatfield boiled down their thoughts to seven fundamental laws that apply to all training (although some sports might have additional laws). These are the seven principles that guided him to squat 1,000lbs without the supportive suit technology available now for powerlifters. He indicated that these laws apply to all types of training and not only powerlifting.

1. The Law of Individual Differences

Everyone has different strengths and weakness, which need to be taken into consideration for the training program. No program fits all individuals. This realization really hits when looking at hip structure. In the picture below, the balls of the two femurs extend very differently. You can imagine that these two people will have very different squat mechanisms. The law extends beyond form and technique as people will have different levels of strength, recovery ability, coordination, and mobility to name a few.

2. The Overcompensation Principle

Our body reacts to stress by overcompensating, so that it can handle stress again in the future. This principle is why beginners at any sport see great improvement when starting their programs.

3. The Overload Principle

In order for your body to overcompensate, you must load it with a greater amount than was already encountered. This principle is the reason that people plateau in their gains over time. It becomes more and more difficult to stress the body to a point where it has not been stressed before.

4. The Specific Adaptation to Imposed Demands (SAID) Principle

The basic tenet of this principle is that you must tax your body in the same way that you want to improve. If you want to be explosive, then you must train explosively. If you want to be strong, then you must train for strength. A simple example is the oft criticized high-rep Olympic lifts in CrossFit. These high-rep lifts may help in building aerobic or glycolytic capacity, but they will not assist in building Olympic weightlifting strength.

5. The Use/Disuse Principle and Law of Reversibility

The first part of this principle is that we must continue train the skill or we will lose that capacity ("use it or lose it"). However, the second part of this principle is that once it has been trained and lost, the skill (or strength) will be much easier to recover than it was to originally train. The idea is that we have laid a neurological foundation that makes it easier to recover the function after we have lost it.
A simple example is the skill of riding a bicycle. We may not have done if for years, but we can pretty much get back on the bicycle and relearn it quickly. For strength training, it can take a little longer to recover to previous levels, but recovery is still at a faster rate than for people who are untrained.2

6. The Specificity Principle

Pavel Tsatsouline calls this principle "greasing the groove."4 If we want to get better at something, we must do that something. If we want to get better at pull ups, do pull ups. Although leg presses might generalize to the squat, the squat itself will build greater squat strength.
This rule doesn't indicate that we shouldn't do ancillary exercises. For example, we might want to work grip strength outside of the deadlift to better hang onto the bar. However, we don't want to do only ancillary lifts as the main exercise benefits our neurological system the best.

7. The General Adaption Syndrome

This principle might subsume the others as it contains three stages that overlap with other principles:
  1. The first stage is called the alarm stage, which is when the body reacts to the application of training stress (similar to the overload principle).
  2. The second stage is the resistance stage, which is when our muscles adapt to increasing amounts of stress (similar to the overcompensation principle).
  3. The final stage is the exhaustion stage, where if we continue to train we will be forced to stop from too much stress.
This syndrome has been revised and renamed the fitness-fatigue model. Much of the revised model is due to individual differences in how novice and elite athletes respond.1 Elite athletes fatigue differently and it takes a great deal more stressor to lead to the resistance stage (or overcompensation).
For novice athletes, exhaustion is easier to reach and thus, it might be best to have a wide range of activities to create fitness (to avoid exhaustion in one activity). It might be one reason for new athletes to gain greatly while beginning CrossFit. However, they need to change their training as they begin to respond differently.

Dr. Hatfield's Perspective on CrossFit

Dr. Hatfield was a multifaceted athlete during college and after (participating in national-level events as a college gymnast (pictured above) and being a strong Olympic and power lifter). If CrossFit were around, he probably would have excelled. However, he had some concerns with the current CrossFit training methods:
I like everything about Cross Fit, but it's not a system of training. By putting together all those different sports and activities … it doesn't make any sense because what you do in one sphere is going to take away in another sphere. For example, you cannot become a great marathon runner and an Olympic weightlifter of note all at the same time.
It's not going to work because the kind of training it takes to create great endurance removes from your ability to lift heavy weights, so you're competing against yourself really by getting into Cross Fit. … I took the time to go over CrossFit's methods with a backdrop of the Seven Granddaddy Laws to see what was going on. … they are breaking almost all the laws.

Take Home

In general these principles indicate that we can't blindly follow programs. We all have different technical backgrounds, skeletal structures, and strength levels, to name a few differences. Our programming needs to be tailored to our goals and to us as individuals following the seven laws described above.
One common idea for a solution is to scale the weight in programs. However, that is only one method of trying to create an optimal program. We also need to consider the other laws in making the best possible program to fit our goals.
References:
1. Chiu, Loren ZF, and Barnes, Jacque. 2003. "The Fitness-Fatigue Model Revisited: Implications for Planning Short-and Long-Term Training." Strength & Conditioning Journal 25 (6): 42–51.
2. Hortobágyi, T., L. Dempsey, D. Fraser, D. Zheng, G. Hamilton, J. Lambert, and L. Dohm. 2000. "Changes in Muscle Strength, Muscle Fibre Size and Myofibrillar Gene Expression after Immobilization and Retraining in Humans." The Journal of Physiology 524 (1): 293–304. doi:10.1111/j.1469-7793.2000.00293.x.
3. Selye, Hans. 1950. "Stress and the General Adaptation Syndrome." British Medical Journal 1 (4667): 1383.
4. Tsatsouline, Pavel. 2000. Power to the People!: Russian Strength Training Secrets for Every American. Dragon Door Publications.


Sent from my iPhone

The Berlin Wall’s great human experiment


image
The Berlin Wall's great human experiment - The Boston Gl...
Twenty-five years ago this fall, a crowd of thousands gathered along the east side of the Berlin Wall and demanded, with the urgency of people who had spe...
Preview by Yahoo

The Berlin Wall was more than a symbol, of course. It literally divided a city and represented the divide between the free and un-free worlds. When it fell, it was easy to forget that those two worlds, the free and the un-free, still existed even though the Wall did not. The symbol was gone and so what it represented was forgotten. Suddenly, evil no longer had a familiar form. As 9/11 taught us, the dangers are real even though the battle lines are hazy.... 

~ Garry Kasparov, November 13: Each generation has its own Berlin wall

by Leon Neyfakh
John Tlumacki/Globe staff/file

A boy waved to soldiers on the Berlin Wall in front of the Brandenburg Gate on Nov. 10, 1989, the day after the wall fell.

Twenty-five years ago this fall, a crowd of thousands gathered along the east side of the Berlin Wall and demanded, with the urgency of people who had spent decades under an authoritarian communist regime, that the border guards let them pass to the other side. That night, the gates swung open and the sledgehammers came out. Soon, the wall was all but destroyed, and the two countries it had kept apart for almost 30 years were finally joined back together.

The collapse of the Berlin Wall, which Germany will commemorate next month with an illuminated display of white balloons where the concrete barrier once stood, was one of the most extraordinary events of the 20th century. Not only was it a crucial factor in the eventual shriveling of communism in Europe, it was also a demonstration of what peaceful protest could accomplish in the face of an oppressive government.

But before it fell, the wall did something that most people never think of: It created a massive laboratory for studying human society.

Imagine this: If you were a researcher trying to determine how a political system affects people's values, beliefs, and behavior, you would ideally want to take two identical populations, separate them for a generation or two, and subject them each to two totally different kinds of government. Then you'd want to measure the results, the same way a medical researcher might give two sets of patients two different pills and then track their progress.

Ethically, such a study would be unthinkable even to propose. But when the Berlin Wall went up in 1961, it created what London School of Economics associate professor Daniel Sturm calls a "perfect experiment." While people in West Germany voted in free elections, read independent newspapers, and protested if they felt dissatisfied with their government, their Eastern counterparts lived inside a surveillance state ruled by a zealously doctrinaire communist party. Where "Ossis"—an unofficial term for those who lived in East Germany—drove famously shoddy Trabant cars, wore drab clothing, and drank off-brand soda, their "Wessi" counterparts enjoyed Pepsi and regularly saw BMWs in the street. The two halves of the country were like a pair of identical twins separated at birth and raised by two very different sets of parents.

Over the past decade, the Berlin Wall has emerged as a uniquely powerful tool for answering questions about politics, economics, and human nature. How well does state propaganda actually work? What role do friendships play in stimulating business and trade? How does living under a repressive regime affect people's inclination to trust strangers and government institutions?

The results have proved exciting for researchers, but their value goes beyond the ivory tower: They're also likely to be important in preparing for real-world situations we may see in the future, like the opening of North Korea and Iran. "Understanding how, say, propaganda created by such regimes affects people's preferences is very important, particularly when these regimes sooner or later collapse," said Alberto Alesina, an economist at Harvard University.

The insights that have piled up since the fall of the wall make it clear how long a single political event can continue to have social and economic effects on the people who lived through it. The marks it left are still being uncovered and measured, more than half a century after the architects of the wall unwittingly made it possible.

The split was formalized in 1949: West Germany became an independent state in Europe; its smaller eastern counterpart, carved from territory the Soviet Union seized after liberating it from the Nazis, slipped behind the Iron Curtain. A little over a decade later, it became clear that unless drastic measures were taken, the massive wave of emigration flowing out of the East would cripple the country. And so a cinder-block wall went up in Berlin, complete with barbed wire and heavily armed guards who would shoot anyone who tried to climb across. Practically overnight, family members who lived on different sides of the wall were separated with no promise of seeing each other again. Grocery stores in the East abruptly stopped importing food from the West. And while there were a handful of checkpoints permeating the wall—which ultimately stretched a total of 96 miles—permission to cross was basically never granted to people from the East.
An East German border guard carried Anna Szczygielski's luggage as the 70-year-old woman crossed the border to be reunited with two grandchildren. Her husband had died a year earlier.
AP/file 1962

An East German guard carried Anna Szczygielski's luggage as the 70-year-old woman crossed the border to be reunited with two grandchildren. Her husband had died a year earlier.

For the next 28 years, East and West Germany were run about as differently as two countries could be. In East Germany's controlled economy, every citizen was guaranteed a (low-paying) job, housing was owned and allocated by the state, and people couldn't buy Levi's jeans except on the black market. West Germany, meanwhile, grew into an economic and industrial powerhouse: By 1989 it was the third largest economy in the world, producing and selling a panoply of consumer goods. Politically, it was wide open; when a magazine editor was jailed for publishing unflattering articles about the military, public outrage was so intense that the editor was freed and and the country's defense minister resigned.

Alberto Alesina was thinking of none of this when he started working on a question that others in his field had found extremely difficult to answer definitively: How important is a country's official ideology in shaping people's political attitudes? A breakthrough came when Alesina spoke to a colleague, the economist Nicola Fuchs-Schundeln, who had recently used data on post-reunification Germany to study whether all the extra money people in the East were earning after the wall came down had made them more likely to save. The same approach, they realized, could help with Alesina's question about political attitudes.

At first, the researchers didn't know what to expect. On the one hand, East Germans might be resentful of the system that had constrained their lives; on the other hand, it was also plausible that they had become comfortable with the notion that a government would provide for basic needs at the expense of an open society.

Alesina and Fuchs-Schundeln used data from a German survey administered in 1997, and split the respondents into two groups based on where they had lived before reunification. What they found was that, at that point, people from the East still tended to believe in the social-service model. They were also more likely to support a robust government program to help the unemployed, and significantly more inclined to believe that social conditions, rather than individual will, determined a person's lot in life.

"We tend to think of preferences as a fundamental thing that economists cannot explain," said Alesina. "[Our paper] says, 'Look...living under a communist regime changes people's political preferences.'"

It goes the other way too, if slowly: When Alesina and Fuchs-Schundeln looked at survey results from 2002, they found that the two groups of Germans had begun to converge politically. Based on the data, they estimated that it would take between one and two generations—20 to 40 years— for the gap to fully close, and "for an average East German to have the same views on state intervention as an average West German."

The differences between the two Germanys went far beyond economic ideology. West Germans all had access to Western television networks, including one that was American-controlled; they watched uncensored newscasts, shows like "Dallas" and "Dynasty," and commercials for everything from Corn Flakes to Volkswagens. Most East Germans could get those broadcasts too, but a significant proportion of them—between 10 and 15 percent—lived in areas the signal didn't reach. These people, concentrated mainly in Dresden and the surrounding Elbe Valley, were sometimes referred to as "the valley of the clueless," forced to watch "political propaganda and Soviet-produced movies," wrote Leonardo Bursztyn, a management professor at UCLA, and his German coauthor Davide Cantoni.

Western television, Bursztyn and Cantoni found, had an impact on East Germans and how they spent their money: Those who'd had access to it were much more inclined to buy Western products they'd seen advertised than those who had not. (In the ongoing debate about whether advertising works at all, consumption data on post-reunification Germany suggests the answer is "yes.") Television affected people's mindset in other ways as well. In a separate but related study, it was shown that watching Western TV had actually shaped East Germans' views about work and chance, making them "more inclined to believe that effort rather than luck determines success in life."

Perhaps the most horrifying aspect of life in East Germany was the surveillance state. Anyone you knew might be an informant to the secret police, the powerful Stasi, who maintained files on an estimated 6 million citizens and were known to pressure people to turn in neighbors, co-workers, and sometimes even friends and family members as traitors. Economists Helmut Rainer and Thomas Siedler used survey data to try to figure out whether living that way had left a psychological scar. They looked at the results of a Germany-wide survey that had been administered twice a year since 1980: According to their analysis, East Germans were much less trusting toward other people than their counterparts.
Perhaps discouragingly, their mistrust did not lift easily when the Stasi's reign ended. When the researchers compared survey data collected not long after reunification to data collected in 2002, it was clear that living in a democracy for a decade had not made East Germans significantly more trusting of others.

Other studies have shown additional lasting differences. One found that, because in East Germany women were encouraged to work more than they were in the West, East Germans were significantly more likely to believe that men and women are equal. Another found that, because the East German regime ran official doping programs for athletes, East Berliners were much more accepting than West Berliners of performance-enhancing drugs 20 years after reunification. Another paper, by Tarek Hassan of the University of Chicago Booth School of Business, looked at how businesses grew and spread when the border fences fell, and found that they tended to follow networks of personal connections. Ossis who did a lot of business with the former Wessis after reunification were disproportionately likely to have had friends, or friends of friends, on the other side of the wall before it was torn down.

These findings might be just the beginning of the Berlin Wall's lessons. "I'm surprised there aren't more people using it," said Daniel Sturm, who coauthored a paper about the economic slowdown suffered by cities that were in the center of Germany before the division but became peripheral afterward. "I think there are lots of open questions that we'll learn more about from observing what happened in Germany."
People massed in front of the Berlin Wall after the border opened on Nov. 9, 1989.
Thomas Imo/Photothek via Getty Images

People massed in front of the Berlin Wall after the border opened on Nov. 9, 1989.
An event that disrupts the lives of tens of millions of people is, obviously, more than just an experiment, and there's arguably something reductive about treating it like one. The researchers are well aware of this moral complexity.

"People have said to me, 'How can you do it?'" said Nicola Fuchs-Schundeln, who is a professor at Goethe University Frankfurt. "It almost sounds like we're saying, 'German separation was a great idea because it allows me to analyze many things.' That's obviously not what we think. But it's true that as scientists, we want to establish some causality, and to establish causality, you need some exogenous event....Often these events are bad—a tsunami, for instance. But we analyze [them] for scientific reasons. It's not that we don't feel for the people, but it allows us to answer questions that we couldn't answer otherwise."

For anyone who remembers its power as a symbol of the Cold War, it will be no surprise that the legacy of the Berlin Wall can still be measured 25 years later—that many Germans who lived in the East continue to feel separate and different from their countrymen. It is still possible, though harder, to close societies off today; many nations still have limited travel, militarized borders, even closed Internets. And while no amount of expert understanding would be worth what Germans suffered, there is some consolation in knowing that their experience could someday help the millions of people around the world on whom a similar experiment is still being run.

Leon Neyfakh is the staff writer for Ideas. E-mail leon.neyfakh@globe.com.

===
From 1961 to 1989, the Berlin Wall split a nation in two and stood as the Cold War's most visible political faultline. It created unforgettable scenes of division while it stood, and reunion when it fell.

Giants Top Minor League Prospects

  • 1. Joey Bart 6-2, 215 C Power arm and a power bat, playing a premium defensive position. Good catch and throw skills.
  • 2. Heliot Ramos 6-2, 185 OF Potential high-ceiling player the Giants have been looking for. Great bat speed, early returns were impressive.
  • 3. Chris Shaw 6-3. 230 1B Lefty power bat, limited defensively to 1B, Matt Adams comp?
  • 4. Tyler Beede 6-4, 215 RHP from Vanderbilt projects as top of the rotation starter when he works out his command/control issues. When he misses, he misses by a bunch.
  • 5. Stephen Duggar 6-1, 170 CF Another toolsy, under-achieving OF in the Gary Brown mold, hoping for better results.
  • 6. Sandro Fabian 6-0, 180 OF Dominican signee from 2014, shows some pop in his bat. Below average arm and lack of speed should push him towards LF.
  • 7. Aramis Garcia 6-2, 220 C from Florida INTL projects as a good bat behind the dish with enough defensive skill to play there long-term
  • 8. Heath Quinn 6-2, 190 OF Strong hitter, makes contact with improving approach at the plate. Returns from hamate bone injury.
  • 9. Garrett Williams 6-1, 205 LHP Former Oklahoma standout, Giants prototype, low-ceiling, high-floor prospect.
  • 10. Shaun Anderson 6-4, 225 RHP Large frame, 3.36 K/BB rate. Can start or relieve
  • 11. Jacob Gonzalez 6-3, 190 3B Good pedigree, impressive bat for HS prospect.
  • 12. Seth Corry 6-2 195 LHP Highly regard HS pick. Was mentioned as possible chip in high profile trades.
  • 13. C.J. Hinojosa 5-10, 175 SS Scrappy IF prospect in the mold of Kelby Tomlinson, just gets it done.
  • 14. Garett Cave 6-4, 200 RHP He misses a lot of bats and at times, the plate. 13 K/9 an 5 B/9. Wild thing.

2019 MLB Draft - Top HS Draft Prospects

  • 1. Bobby Witt, Jr. 6-1,185 SS Colleyville Heritage HS (TX) Oklahoma commit. Outstanding defensive SS who can hit. 6.4 speed in 60 yd. Touched 97 on mound. Son of former major leaguer. Five tool potential.
  • 2. Riley Greene 6-2, 190 OF Haggerty HS (FL) Florida commit.Best HS hitting prospect. LH bat with good eye, plate discipline and developing power.
  • 3. C.J. Abrams 6-2, 180 SS Blessed Trinity HS (GA) High-ceiling athlete. 70 speed with plus arm. Hitting needs to develop as he matures. Alabama commit.
  • 4. Reece Hinds 6-4, 210 SS Niceville HS (FL) Power bat, committed to LSU. Plus arm, solid enough bat to move to 3B down the road. 98MPH arm.
  • 5. Daniel Espino 6-3, 200 RHP Georgia Premier Academy (GA) LSU commit. Touches 98 on FB with wipe out SL.

2019 MLB Draft - Top College Draft Prospects

  • 1. Adley Rutschman C Oregon State Plus defender with great arm. Excellent receiver plus a switch hitter with some pop in the bat.
  • 2. Shea Langliers C Baylor Excelent throw and catch skills with good pop time. Quick bat, uses all fields approach with some pop.
  • 3. Zack Thompson 6-2 LHP Kentucky Missed time with an elbow issue. FB up to 95 with plenty of secondary stuff.
  • 4. Matt Wallner 6-5 OF Southern Miss Run producing bat plus mid to upper 90's FB closer. Power bat from the left side, athletic for size.
  • 5. Nick Lodolo LHP TCU Tall LHP, 95MPH FB and solid breaking stuff.