Showing posts with label Dr. Ramy Elitzur. Show all posts

Tuesday, December 20, 2022

MLB Wins over Expected Wins pre and post adoption of Moneyball by Charles Slavik


https://public.tableau.com/views/MLB_WINS/Sheet1?:language=en-US&publish=yes&:toolbar=n&:display_count=n&:origin=viz_share_link


Monday, March 16, 2020

What's Cool on Campus - Data Analytics and Moneyball MLB and NCAA research


Part One: Open Letter to UNF Athletics: What's Cool on Campus - Data Analytics (UPDATE)

JACKSONVILLE, FL - After my initial research on the topic in September 2019, I continued researching data analytics adoption at the NCAA team level, adding six teams to the initial survey presented to the administration. 

The approximate 4 - 6 increase in wins over the trailing eight-year average of wins -- or wins expected -- remained in place. 

Growing number of programs finding or renewing success: (2019 record versus 2011-18 record)


Next, I looked at the final 2019 College Baseball poll from USA Today. I added a Y/N to sort for teams that had publicly announced their use of data analytics. An earlier USA Today article had mentioned Louisville and Texas Tech as College World Series participants that did not have an existing analytics program in place.  

from USA Today:
https://www.usatoday.com/sports/ncaa-baseball/polls/coaches-poll/2019/

2019 Final USA Today College baseball Poll - by adoption of data analytics
  • Seventeen of the Top 25 teams had adopted data analytics (68% rate).
  • Adoptees median number of Wins were 4 greater than non-adoptees, W% was 0.031 greater, which implies approximately +2 Wins. 
  • Adoptees tended to play later into the post-season than non-adoptees.
  • In other words, adding 2 - 4 wins while playing amongst the most competitive sub-set of teams you could select is meaningful. 
Next, I looked at adoption rate by conference. Here is where I feel the story began to expand and crystallize. 

I examined the Power-5 conferences (P-5) and selected Non P-5 conferences like the ASUN. This revealed the following:


  • The Power Five conferences (P-5) adopted at a 55% rate versus 14% for Non P-5 conferences. 
  • The SEC had adopted at 86% rate and the ACC at 64% rate, the highest rates observed. 
  • The SEC is on track to hit 100% by 2021. 
  • The Power 5 Conferences are on track to hit 100% by 2022.


Non P-5 schools, by contrast, are on an estimated adoption rate that mimics MLB's rate of increase (as shown below). This puts them on path to hit 100% by approximately 2032.  

That 10-year gap, if the Non P-5 status didn't do it, will relegate these schools to long-term, if not permanent, 'have-not' status in collegiate baseball. 


Year 1 = 1997 for MLB and 2017 for college baseball. 

Elitzur's MLB Timeline of Adoption (SABR teams over time)

These conclusions, if they hold true, are somewhat ironic in that one pillar of the Moneyball Theory and Dr. Elitzur's study, is that in MLB, poorer teams used data analytics to gain advantage against richer teams, in what was inherently an unfair contest between unequals. 

The analogy to college baseball flips that framework on its head in that richer teams are adopting it to further cement their advantage over less well-endowed competitors. 

 
Cum Wins v. Cum Payroll (1998-2016) - Avg. Payroll v. Diff. Wins vs. Expected Wins

Here is where things get interesting. I examined cumulative wins (from baseball-reference.com) versus cumulative payroll (from Lahman database) and applied conditional formatting to identify the top ten teams (green) and the bottom ten teams (red) by each category. The (white) cells are the middle teams per category. 

In the first category, cumulative wins and cumulative payroll, the Red Sox and Yankees (coded green-green) bludgeoned the field as top ten in payroll and top ten in wins. Not a huge surprise. 

Pittsburgh and the Rays (coded red-red) were bottom ten in both categories and that is not a huge surprise either. A 0.77 correlation between wins and payroll should come as no surprise either, it's the basis for the so-called "competitive balance tax" or de-facto salary cap. 

Cum. Wins v. Cum. Payroll (1998-2016) grouped by 10's

If you expand the conditional formatting here to show top ten-bottom ten-middle ten by category, you get some unusual pairings. 

Green-Green = BOS,LAA,LAD,NYY,SFG,STL
Green-White = ATL,CLE,TEX
Green-Red = OAK
White-Green = CHC,NYM,PHI
White-White = CHW,CIN,HOU,SEA,TOR
White-Red = ARI,MIN
Red-Green = DET
Red-White = BAL, COL, 
Red-Red = KCR,MIA,MIL,PIT,SDP,TBR 

This analysis looks at the absolute level of spending and the absolute level of wins. The top and the bottom level teams are segregated on that basis with only Oakland delivering on the upside as far as wins relative to payroll in aggregate which makes sense. They are the crown princes of Moneyball. 

Detroit finishing lower third delivering wins while spending in the upper third on the payroll side makes them the anti-Moneyball franchise so far.  

But is that the fairest way to grade franchise when the premise is to spend money efficiently rather than wastefully or recklessly?


Sum of Wins Over or Under Expected Wins and Avg Payroll Level


From the baseball-reference.com historical wins by team/year data, an "expected wins" field was created by weighting the prior three years win total, as is commonly done with projections. 

2019EW for example would be ((2018 W * 3) + (2017 W * 2) + (2016 W * 1)) / 6. 

OUW would then be the Over / Under of Actual Wins versus Expected Wins. 

I applied the same conditional formatting rules to sort in top-middle-low ten team buckets and calculated the following matrix of Wins Expected versus Average Payroll. 


Elitzur Wins -  Payroll Matrix

In my opinion, this gives a reasonable snapshot of which teams are more successfully employing the Moneyball concept of "doing more with less." 

High Wins over Expected with Low Payroll:
Oakland, Tampa Bay and Minnesota have had good success doing more with less. Arizona and Washington are also consistently on top pf their divisions. 

Low Wins over Expected with High Payroll:
Detroit and the Los Angeles Angels have had a bad run while spending at some of the highest levels. A bad combination recently.  

High Wins and High Payroll:
Boston, Chicago Cubs and Philadelphia fall into this category. High spending but high wins over expectations to match. 

High Wins with Middle range Payroll:  
Cleveland Indians with some consistently good years and the Houston Astros with some feast or famine years and a relatively new adoptee of data analytics (2012) scored well on Over/Under Wins, especially recently. 

This introduces another interesting observation which may appear to run counter to one of the earlier observations, that "if you were not in early, you were left behind."


click link above to see in Tableau:

Some teams who were late adopters of an analytics driven approach have had recent success in terms of wins above expectations (OUW):

Houston and Chicago Cubs (2012) and +8.63 / +3.06 OUW
Minnesota (2015) and +8.06 OUW
Philadelphia (2016) and Arizona (2017) +5.08 / +7.44 OUW

Houston and the Cubs have had good success but will regress somewhat as they add more years under adoption. Minnesota, Philadelphia and Arizona are more recent small sample size successes with only three to four years under adoption. 

Those team's recent successes, added to the previous success of the A's and the Rays, lend themselves to a belief that the teams that "need" to succeed with a Moneyball approach the task with a "have to have this work" mentality rather than a "nice to have" it work, if not throw some money at the problem. Failure is an ever-looming, existential threat to their success. This leads to a deeper commitment to the task and a greater buy in from everyone in those organizations. 

For the high payroll, high to middle success teams, data analytics is "nice to have" but not really "have to have". There is a safety net of the owners checkbook, an "in case of fire, break glass" option lesser well-endowed teams do not have, that blurs the amount of credit that should be given to data analytics for success in the W column. The low payroll teams are overcoming the 0.76 correlation between payroll and wins, the high payroll teams are surfing it to success. 

Each successive CBA defines the rules of engagement teams operate under and they naturally lend themselves to this type of stratification and perhaps always will. Organizations and staff at all levels are constrained by these rules and work with them and in some cases around them to the best of their ability in order to succeed.

On the collegiate side of the ball, college teams that lag in adoption could see some glimmer of hope from the late-adopters in MLB, however with the greater disparity and distribution of talent and the differences in the rules of engagement the NCAA and their member conferences set up between the teams, that glimmer of hope quickly morphs into a chasm of despair.  

Going forward, I would like to take more of a flow versus stock comparison, ie: change in Win Expectation versus Y-O-Y changes in payroll historically and see what that reveals.


References:
Elitzur, Ramy. “Data analytics effects in major league baseball.” (2020).

Friday, March 13, 2020

Open Letter to UNF Athletics: What's Cool on Campus - Data Analytics (UPDATE)


JACKSONVILLE, FL - Update: This was a presentation made to relevant stakeholders in the success of UNF Baseball in September 2019 regarding the need to utilize data analytics to improve the team's chance of success in the current environment. 

Of the first seven teams on the UNF 2020 baseball schedule, five of them (Rutgers, South Carolina, Central Michigan, Ohio State and Illinois State) use data analytics to improve their team performance. We posted a 1-9 record against the schools listed. 

We didn't make much headway convincing the current administration that this was necessary back then. However, as we see from our 2020 schedule, the trend of adoption by other schools has accelerated since we presented. 

"You can ignore reality, but you can't ignore the consequences of ignoring reality." - Ayn Rand

This is a look at UNF Baseball Historical W-L record. 


Here again, the trend is clearly not our friend. I don't even want to do a "What if " analysis or forecast sheet on when the program wakes up and realizes that this once proud program is playing to a sub- .500 Division I record. 

It's time to decide what type of program this is and what it wants to be going forward. Thankfully, there is not the pressure of a relegation system in place. Perhaps that would force action, but that shouldn't be the catalyst. Leadership and vision should have been. 

It's time to act and give these kids the tools they need to compete at the level the university chose to compete at. To do less is unfair to the kids. You cannot run a DI program on a DII budget. Finances should not be an issue as this isn't a particularly expensive proposition. 


NEED:

What's Cool on Campus? Charlie Young and Illinois baseball analytics


Illinois and Elon, among others, have improved their programs as a result of the technologies. There are benefits to future sport management and statistics majors to help implement and maintain the systems and produce reports. The cost of tools, like Flightscope, Rapsodo Yakkertech and Hawkeye, are reasonable considering the potential benefits. I believe that within 5-10 years, virtually all baseball programs around the country will be using these tools to improve their teams economically. 


‘If You Don’t Have It, You’re Behind’: College Baseball’s Tech Arms Race


“The technological wave that swept M.L.B. has reached college baseball, but the price of high-tech devices has created a bigger gulf between the haves and have-nots.” - www.nytimes.com

“Tech is the newest recruiting tool in Division I, the latest separator between haves and have-nots.”


Forbes Magazine seems to agree with this revolution. In an article about new technology in baseball, it says “Tech is the newest recruiting tool in Division I, the latest separator between haves and have-nots. 

Six of the eight schools that reached the College World Series — all but Louisville and Texas Tech — said they had purchased high-end analytic devices in the last two years

“Why Technology Defines the Future of Baseball”


It doesn’t matter who you ask these days. Twins reliever Taylor Rogers was quoted on MLB.com saying that due to new technology he’s learned more in the past month than in the past four or five years.” Blue Jays righty Ryan Tepera says, “That’s the new phase of baseball we are in.”

“Technology Pioneers See First-Mover Advantage”


By far the most intriguing finding in the research is the correlation between the early adoption of new technology and company performance. Pioneers are growing faster than other companies and beating their competition. Twenty percent have experienced more than 30% growth—twice that of Followers and more than three times that of the Cautious. Firms that identified themselves as Cautious were the most likely to report no growth.


IMPACT / EFFICACY / CALL TO ACTION / URGENCY:

Growing number of programs finding or renewing success: (2019 record versus 2011-18 record)


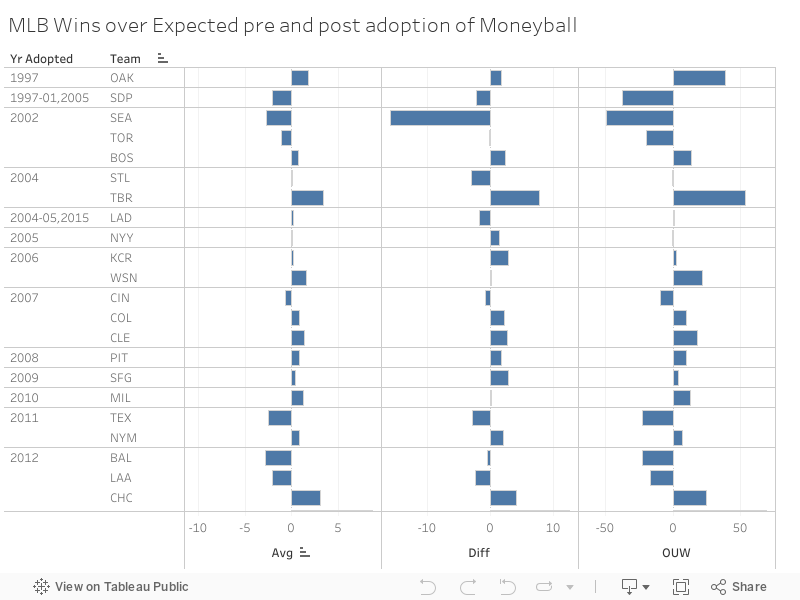
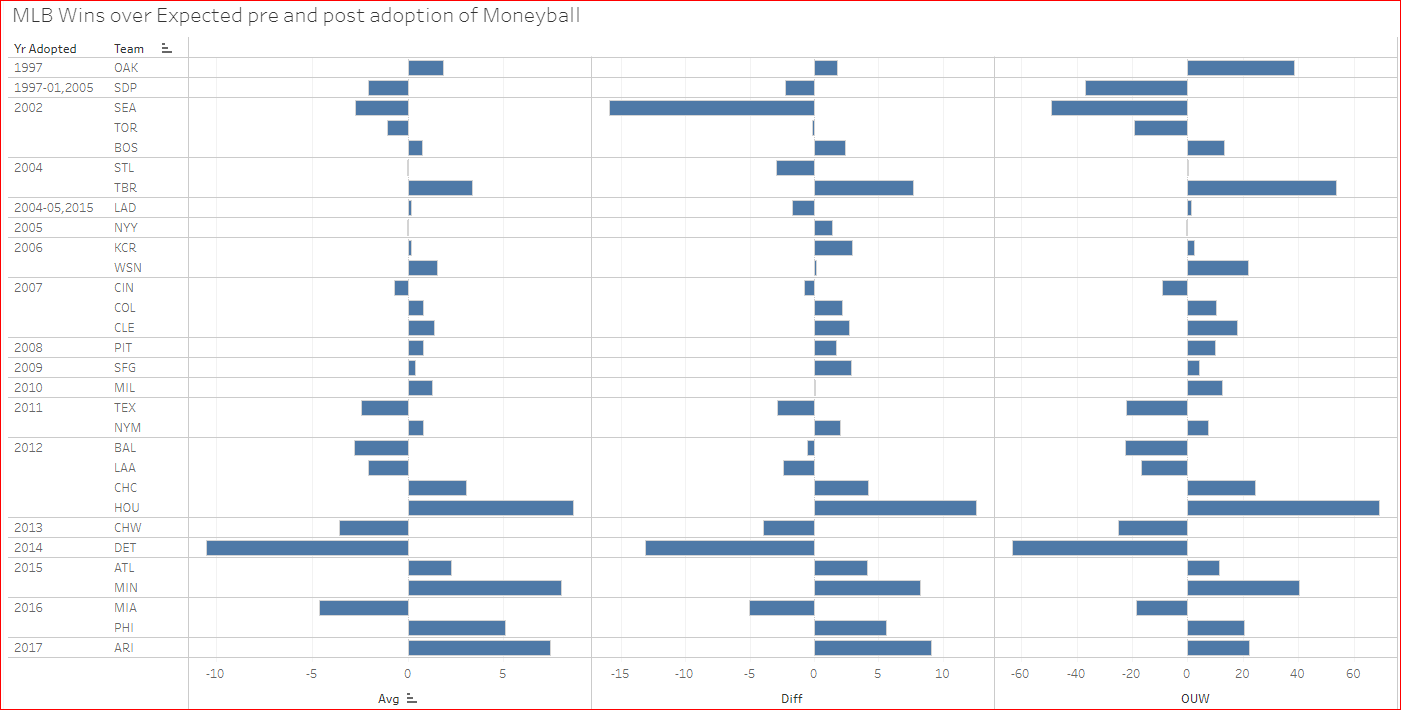
Teams that are known adopters of a data analytics driven approach have averaged between 3.98 – 5.61 additional wins over their prior eight years average wins, a proxy for their “true talent level” or expected number of wins per season. 

Nine of Eleven (82%) teams experienced success and two (18%) had down years. Of those that experience gains in wins, those gains ranged between (1.3 – 19.0) additional wins and averaged (5.61) additional wins.

From UNF baseball’s perspective, their eight-year prior record averaged 33W - 23.5L, a plus or minus swing of 5 games results in either an expected record of between 38-19 or 28-29. A record of 33-24 would be the mid-point, approximately where the team finished in 2019.  

The future options are somewhere between a team with legitimate post season aspirations and potential Top 25 ranking and one that has little or no post season expectations, with maintaining current position in the conference, a possible, but not attractive third option based on the fast changing environment.   

Two of nine conference foes have technology (22%) which mirrors estimate of penetration in Division I schools overall. Twenty-two percent equals 66 of 300 DI schools, basically equal to number of teams in the Power Conferences.

This is when the train is moving slow and you can still jump on board. The next stage, when early majority and late majority schools get on board, competitive gains will slowly erode to zero and then negative.

In terms of the 300 DI baseball schools, UNF ranks right somewhere between the 40-50th percentile based on recent performance. As shown by the technology adoption curve below, UNF ranks somewhere between early and late majority adopters (50th percentile). The pace of adoption from 22% to 50% penetration will accelerate and likely not take another 2-3 years.

As both the NYT and Forbes articles above suggest, within another two to three years, the opportunity to be a leader or an early adopter will have been lost.  The train will have left the station; laggards will be punished by their faster acting competition (see Technology Adoption Curve illustration below).

Accelerated by digital: A timeline of technology adoption curves, shifts in industry are exponential not incremental. Stand out or step back is the by-word.


Rogers Technology Adoption Curve meets Elitzur’s decreased comparative advantage

URGENCY:

“Moneyball advantage peters out once everyone's doing it” - author Ramy Elitzur, the Edward J. Kernaghan Professor of Financial Analysis and associate professor of accounting at the University of Toronto's Rotman School of Management.

Paper shows baseball data analytics only an advantage when few used it


When you have a secret sauce and nobody else knows about it, you have a competitive advantage. Once the secret sauce was outed, which was what happened with the book, everybody could imitate the Oakland A's."
Dr. Elitzur created a database for the study, inputting information from 1985 to 2013 about team payrolls, playoff success, the spread of data analytics use, and players' overall contributions to their team, represented by a key statistic from Moneyball's "sabermetrics," -- the type of data the Oakland A's used to identify lower-priced, undervalued players through statistics such as how much time spent on base.
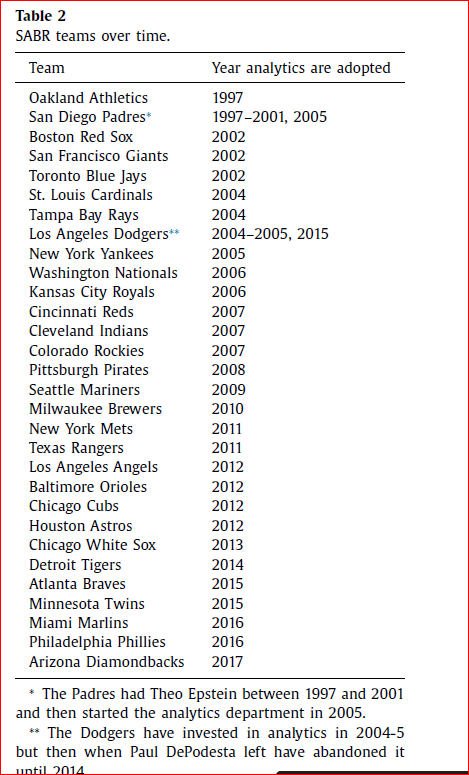
He found that between 1997 and 2001, there were only two "Moneyball" teams in the MLB. Another three teams had taken up the practice by 2002. 

By 2013, more than 75 percent of MLB teams were using it. Sabermetrics gave teams the strongest advantage up until 2003, the year Moneyball was published. 

By 2008, the comparative advantage was lost as more and more teams adopted sabermetrics. The practice of data analytics also spread beyond sports, to business and government.

Other /ancillary benefits created between teams and schools within the university:


UNEXPLORED OPPORTUNITIES – CLUBS ON CAMPUS

Tracking data takes time and time is limited, explicitly by the NCAA and by the volume of tasks coaches must take on just to keep programs afloat and on-budget.

However, there are students right now who are:
1.            Analytically-minded
2.            Willing to work for free (class projects, practicums and internships)
3.            Love baseball

Students can be found in most school’s computer science/math/economics clubs. This is an area of opportunity that small schools have that is underutilized. Aid and assistance from students / clubs, in addition to generating buzz for the teams and the university can help baseball the most, given the recent rejection of a third paid assistant coach.

Player development analytics is currently a wide-open field. No MLB team is going to make their sensitive, proprietary player data available to the public. Talented analytics people, those who aspire to the MLB analytics jobs of the future, don’t have a lot with which to work.

Schools can develop this as an opportunity zone for students. A couple of seasons of analyzing player data adds real-world experience to enhance their resume for MLB internships / jobs. The insights they can uncover helps the team win games. It’s a win-win situation.


THE REVOLUTION REACHES COLLEGES….and SOFTBALL!!


This revolution has continued to spread, most recently reaching college baseball. Upwards of 50 colleges are collecting in-game data. Another 40 to 50 have bullpen units to assist with improving pitching. BaseballCloud has emerged as a great database company with analytics to assist the coaches. The momentum is clearly there now, and teams are all looking for technology they can implement to improve their team.

The data revolution is now starting to be recognized in softball. At least one major program is installing an in-game system

Softball academies are popping up, as are large facilities for holding very large tournaments – and these facilities are interested in in-game systems as well. The price point is reasonable, and coaches are understanding the value for player development.

“When performance is measured, performance improves. And when it is then reported, improvement occurs again.”

These coaches leading the data revolution in softball also see the value in being able to better recognize high school players for recruiting.

At Yakkertech, we are so excited to be a participant in supporting softball programs. Our in-game and bullpen system are ideal for enhancing player development. So to all the folks in the softball world – enjoy the revolution! It’s here!


Player development is a key element in baseball. There is one somewhat simple metric that shows the changes now in the “how and where” of the development of young, promising players. In the past 10 years, the percentage of players chosen in the first ten rounds of the draft from colleges has gone from 52% to over 75%.

While some colleges are also using technology and more scientific methods to enhance player development, they are still hounded by W’s and L’s to validate their existence as a coach. But that being said, many colleges now see that they can enhance performance of their players by having the technology and priority to use to make their players better……..Academies and colleges – that’s where players are obviously getting better……Makes things easier for the MLB, and they obviously see it!


BUDGET – FEASIBILITY & CONSTRAINTS:


TIER 2 – SMALL TO MEDIUM INVESTMENT
These can be applied in stages, one per year. Or, with a dialed in process for collecting data, you can do a big fundraiser to scrape together the $10,000-$15,000 it will take to purchase this all at once.

Note: @ $9K - $27K expenditure per sport (for Rapsodo H&P + Flightscope) implies approx. $1.8K-5.4K depreciation/replacement expense per year

References:

Elitzur, Ramy. “Data analytics effects in major league baseball.” (2020).


Giants Top Minor League Prospects

  • 1. Joey Bart 6-2, 215 C Power arm and a power bat, playing a premium defensive position. Good catch and throw skills.
  • 2. Heliot Ramos 6-2, 185 OF Potential high-ceiling player the Giants have been looking for. Great bat speed, early returns were impressive.
  • 3. Chris Shaw 6-3. 230 1B Lefty power bat, limited defensively to 1B, Matt Adams comp?
  • 4. Tyler Beede 6-4, 215 RHP from Vanderbilt projects as top of the rotation starter when he works out his command/control issues. When he misses, he misses by a bunch.
  • 5. Stephen Duggar 6-1, 170 CF Another toolsy, under-achieving OF in the Gary Brown mold, hoping for better results.
  • 6. Sandro Fabian 6-0, 180 OF Dominican signee from 2014, shows some pop in his bat. Below average arm and lack of speed should push him towards LF.
  • 7. Aramis Garcia 6-2, 220 C from Florida INTL projects as a good bat behind the dish with enough defensive skill to play there long-term
  • 8. Heath Quinn 6-2, 190 OF Strong hitter, makes contact with improving approach at the plate. Returns from hamate bone injury.
  • 9. Garrett Williams 6-1, 205 LHP Former Oklahoma standout, Giants prototype, low-ceiling, high-floor prospect.
  • 10. Shaun Anderson 6-4, 225 RHP Large frame, 3.36 K/BB rate. Can start or relieve
  • 11. Jacob Gonzalez 6-3, 190 3B Good pedigree, impressive bat for HS prospect.
  • 12. Seth Corry 6-2 195 LHP Highly regard HS pick. Was mentioned as possible chip in high profile trades.
  • 13. C.J. Hinojosa 5-10, 175 SS Scrappy IF prospect in the mold of Kelby Tomlinson, just gets it done.
  • 14. Garett Cave 6-4, 200 RHP He misses a lot of bats and at times, the plate. 13 K/9 an 5 B/9. Wild thing.

2019 MLB Draft - Top HS Draft Prospects

  • 1. Bobby Witt, Jr. 6-1,185 SS Colleyville Heritage HS (TX) Oklahoma commit. Outstanding defensive SS who can hit. 6.4 speed in 60 yd. Touched 97 on mound. Son of former major leaguer. Five tool potential.
  • 2. Riley Greene 6-2, 190 OF Haggerty HS (FL) Florida commit.Best HS hitting prospect. LH bat with good eye, plate discipline and developing power.
  • 3. C.J. Abrams 6-2, 180 SS Blessed Trinity HS (GA) High-ceiling athlete. 70 speed with plus arm. Hitting needs to develop as he matures. Alabama commit.
  • 4. Reece Hinds 6-4, 210 SS Niceville HS (FL) Power bat, committed to LSU. Plus arm, solid enough bat to move to 3B down the road. 98MPH arm.
  • 5. Daniel Espino 6-3, 200 RHP Georgia Premier Academy (GA) LSU commit. Touches 98 on FB with wipe out SL.

2019 MLB Draft - Top College Draft Prospects

  • 1. Adley Rutschman C Oregon State Plus defender with great arm. Excellent receiver plus a switch hitter with some pop in the bat.
  • 2. Shea Langliers C Baylor Excelent throw and catch skills with good pop time. Quick bat, uses all fields approach with some pop.
  • 3. Zack Thompson 6-2 LHP Kentucky Missed time with an elbow issue. FB up to 95 with plenty of secondary stuff.
  • 4. Matt Wallner 6-5 OF Southern Miss Run producing bat plus mid to upper 90's FB closer. Power bat from the left side, athletic for size.
  • 5. Nick Lodolo LHP TCU Tall LHP, 95MPH FB and solid breaking stuff.