Showing posts with label Roster Construction. Show all posts

Monday, February 17, 2020

WEEK ONE: Tough Weekend for the BirdsofStray...: and me (TOTO Edition)

Image result for unf baseball

JACKSONVILLE, FL - It could have been worse. Maybe a walk-off balk call from walking away from the series 1-2 instead of 2-1 (It was a balk!! Watch the replay, he flexes the back knee twice, plus other balky moves prior.) The week starts with projections, prognostications and watch-lists, so that's as good a place as any to start. I agree with the "best news" analysis from Baseball America about Eddie Miller.

from Baseball America:
https://www.baseballamerica.com/stories/2020-atlantic-sun-conference-college-baseball-preview/
The best news on the mound for UNF is the return of closer Eddie Miller (1.31, 8 saves), who set the single-season ERA record for the program with his performance last year. The return of catcher Tanner Clark (.306/.407/.398), who was an effective part of the lineup in a limited role last season, will help, but UNF’s offensive success will likely be closely tied to the success of power-hitting junior college transfers in first baseman Trey Spratling-Williams and third baseman Ricky Presno.
I also agree with the assessment of Tanner Clark and the afterthought about the infusion of talent from the JUCO ranks, but first let's flesh out the analysis from graduation of last year. The Birds of Stray lost five productive mainstays from last year lineup due to graduation.


Gory Math details:
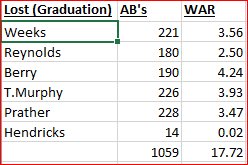
Based on their OBA/SPct and # of AB's these five hitters produced almost 18 Wins above Replacement (WAR). Replacement being the "next man up" or next best available bat after the first nine starters (since we DH). WAR is calculated by multiplying (OBA * Slugging Pct * # AB's) to come up with Runs Created attributable to that players production. Approximately 9 Runs Created equals 1 Win, so RC / 9 = WAR. You can adjust each hitters raw RC (and therefore WAR) by adjusting AB's to 200. 
So, losing Wesley Weeks, Alex Reynolds, Chris Berry, Tanner Murphy and Jay Prather sets the 2020 Ospreys back about 18 wins, but creates the opportunity of about 1,050 AB's or five new lineup slots open to competition.


Presumably, returning upperclassmen from the prior year scarf up the spots. But five is a lot of slots. The best RC or WAR values from returning players are shown above and after adjustment to 200 AB's, we see what appears to be 14 of the 18 wins coming back except for two things. Maberry is gone to parts unknown, for reasons unknown, taking 3.60 WAR and a productive RH bat with him. The 3.60 WAR gets replaced, but at ~ 1.95 replacement level. So now, we're down 5.65 because of some stupid childish shit or a lack of leadership. Self-inflicted wounds are the worst.

But wait, there's more.

As Baseball America alludes to, Tanner Clark blah, blah, blah "in a limited role"  presumably with Hurwitz, also a C, also a LH hitter, so it's not a pure platoon role that limited him. I'm not sure they aren't questioning why one can't DH while the other C's so you can share the catching workload while not losing a productive bat. Don't know what other factors might be in play, but in a perfect world they both get 200 AB's in a season rather than 200 in total. Doubling both of their AB's this year would recapture about 3 of those lost wins. That's a simple lineup optimization fix. Once again, avoid self-inflicted wounds, your opponent will make enough of them for you.

So, five lineup openings, Marabell and May plus either Clark/Hurwitz or Clark and Hurwitz, gives you at worst two, maybe only one JUCO that must step forward and produce. More AB's flowing to Hurwitz and Clark starts to tip the lineup a bit to the left side. Given that the three most prominent JUCO hitters (Presno, Spratling-Williams and West) are also LH poses a bit of a lefty-righty dilemma.

Given that a) runs will be harder to come by this year versus last and b) it's hard to see too many instances of subbing for defense, it seems that lineup optimization to squeeze out as many runs as possible is Priority 1 ahead of platooning or defensive substitutions.

Last years team missed Win Expectation by 2.50 Wins last year based on the RC formula from above and applying the Pytagorean Theorem for Baseball to calculate Wins Expected. The difference there could arise from a couple of blowouts skewing the data or optimizing your lineup to produce the most runs possible.


If we assume that the pitching staff holds opponents to roughly the same numbers (ceteris paribus) as last year, which is not unrealistic, We get the following numbers as far as RC -> opponents RC -> Est. Win Pct -> Est. Wins. We did lose quite a bit of talent on the pitching side, but the returning pipeline of talent seems to be there to replace the graduates.


Pitching has some runway to regress back to 2019 numbers while hitters will have to improve into the teeth of opposition pitching that gets tougher as the schedule gets longer. Same is true for the pitchers about batters faced, but they have some breathing room for now. I thought we would fatten up the hitting statistics in this series, but that's in the past. If the staff can hold the fort on their side, especially early in the season, the hitters don't have to do as much early and the talent has time to acclimate.

And yes Virginia, there is a difference between JUCO and D1 Baseball. If you don't believe me see Jeff Zimmerman's FanGraphs article from 6/28/2016 on the subject where he found that transitions from JUCO to D1 averaged:

-.063 AVG,  -.057 OPB,  -.067 SLG, K's +4.5% of ABs and BB% -0.6% of AB's

Those numbers would be acceptable off a weekend where our JUCO hitters posted two hits in 25 AB's. It's still early and anybody can be almost anything over the course of 40 AB's, even in the major leagues. You need to see where everyone stands after 400 AB's.


Sunday, September 01, 2019

The role of analytics and the analyst in baseball


Role of the analytical staff
The role of analytical staff is to communicate relevant information to a diverse group of end users in a format that is actionable and understandable for them to improve task performance and operational efficiency. One of the more successful franchises, the Houston Astros under Jeff Luhnow, refers to their analytics department as “decision sciences”, which aptly describes the roles. They acquire information and develop models that help their decision makers - the GM, farm director, scouting director or manager – make better decisions.
Skills that are helpful to your career:
  • analytical and creative mind
  • advanced excel skills
  • reporting and data visualization skills
  • scripting and statistical language skills
  • SQL programming skills
  • teamwork
  • skills in any of the following are helpful (R, SQL, Python, Tableau, SPSS)
  • skills with Big Data tools (Hadoop, Hive, Pig)
Role of analytics for “Above the Field” GM decisions
In some manner, shape or form analytics now permeates every decision a team makes from hot dog prices to contract negotiations. The top role would be to put a winning product on the field given whatever budgetary constraints are mandated by either team ownership or the Collective Bargaining Agreement (CBA). Given those parameters, roster construction and control of player assets would seem to be at the top of the list, from which success in other areas would follow.

As illustrated by the website https://www.thebaseballgauge.com/ there are three main ways to acquire and develop talent:
Internally/Home-Grown:
  1.  Through the Rule 4 Draft (conducted in June)
  2.  International Free–Agents (International signings) or externally
  3.  Via Trades, Free–Agent signings, Rule 5 draftees
The BaseballGauage.com website displays and sorts totals by team and year.


https://www.thebaseballgauge.com/history.php?first=min&last=max&tab=tm_analysis (slow to load)

Home-Grown as they define the term appears to include the sum of Rule 4, and Amateur Free Agents (INTL), with some rounding issues. Approximately 40% of productivity from talent (WAR) comes via the Home-Grown route. Trades provide 38% and free-agent signings 22%. Trades seem to be where the highest % of WAR is accumulated according to these numbers and they also appear to more highly correlated to winning percentage of late. Evaluating trades is becoming a more important task for analysts and becomes more difficult if prospects are involved as opposed to players with a MLB track record.

I compared the cumulative WAR for each roster approach for the most recent season ended, 2018 and from seasons 1991-2013 to see if there was change over time in the effectiveness of each approach.

Correlation of WAR to Win %
Approach 20181991-2013
Home Grown0.560.56
Trades0.800.48
Draft0.500.34
Free-Agents0.460.37
Amateur Free-Agents0.200.49
Other0.05-0.41

Analytics is very important in deciding on value for arbitration cases. Players in the 1-6 year service time bucket are getting paid higher and higher amounts based on prior decisions and reasonable comps. Front offices can save salary dollars by making prudent judgments and avoiding arbitration entirely or making reasonable offers so that they win when they are forced go to arbitration. A framework for financial resources needed could be made based on this and other pieces of information and would vary based on where each franchise sits currently and how they have executed in each area recently. Given that, approximately 40% of productivity from talent (WAR) comes via the Home-Grown route. Trades provide 38% and free-agent signings 22%. Trades seem to be where the highest % of WAR is accumulated according to these numbers and they seem to be correlated higher to winning percentage more recently. Evaluating trades is more important and more difficult if prospects are involved.

Rosters and priorities can change in a hurry given players aging curves, which have been shifting to the left since the end of the “PED era” and the advent of more stringent drug testing that includes amphetamines.

 Role of analytics for “On the Field” in-game decisions

Some of the most exciting developments in analytics are in this area due to technologies like TrackMan, Rapsodo and Flightscope among others. It allows fans in many respects to see, and analysts to quantify objectively instead of subjectively, why players are great.

Lineup optimization, which "The Book" by Tom Tango and others goes into has caused us to re-think where to place hitters in the lineup to optimize teams run-scoring ability. Player usage is changing before our eyes with the use of defensive shifts and “openers” taking the place of starting pitchers. Credit is given to the Rays for accelerating the use of both, but in fairness, the concept of “openers” was discussed in the classic sabermetrics book “Percentage Baseball”, by Earnshaw Cook published in 1966.

Cook laboriously and meticulously proposed that pitching staffs, who were previously going 5 innings by the starters, to be replaced by a reliever going 2 innings then another closing the final two innings (S5: R2: R2) would be better utilized and workload more efficiently allocated by a system where a reliever would go the first two 2 innings (he didn't call it an opener), then the “starter" would go 5 innings, then a closer would pitch the final two innings. (R2: S5: R2). Cook added that each pitching change would be initiated by a pinch-hitter, which would improve offensive production at the same time pitching assets would be used more productively. This was pre-DH and considered revolutionary, so it was mocked and ridiculed. The Rays may have proved that although necessity may not always be the mother of invention, it certainly can be a catalyst for action.

Wearable technology shows the promise of allowing training and medical staffs to manage workload and usage better and achieve, if not the holy grail of predicting or preventing injuries in their entirety, at least reducing them significantly.

Quantifying intangibles is an area that warms my old-school heart and “In Search of David Ross” or Jonny Gomes is now at the top of my reading list. I know “not everything that can be counted counts and not everything that counts can be counted” but you still must make the effort. Intangibles – Luck – Residuals what’s the distinction?

I’ll close with a Bill James' quote/question: “What is the relevance of sabermetric knowledge to the decision-making process of a team?” Answering that question, to me, is the role, the purpose and the mission statement for data analysts. The next article will be about the use of analytics in arbitration, salary negotiation and valuation concepts.

Charles Slavik is a Sport Management student at University of North Florida, Go Ospreys!! and is primarily interested in data analytics and baseball. He can be reached at https://twitter.com/theslav1959  or read at The Slav's Baseball Blog - BASEBALL 24-7-365 http://slavieboy.blogspot.com/ .

Wednesday, June 25, 2014

The parents' guide to tee ball sabermetrics. | SportsonEarth.com : Mike Tanier Article


Hilarious article and spot on. I don't see "GLM" on the list -- that may be for more advanced LL'ers and coaches-- but it is alluded to under Lineup Optimization.  Pure LL stuff, right there.  There does seem to be one "TPar" per team. That dynamic doesn't seem to change. 


from SportsonEarth.Com
The parents' guide to tee ball sabermetrics. | SportsonEarth.com : Mike Tanier Article:

Tee Ball Outsiders Glossary of Terms

3 True Outcomes. In tee ball: Hitting a ground ball, whacking the tee with the bat, swinging the bat around and around saying "Whee! I'm a helicopter!"
5-Tool Parent. A parent who: 1) remembers the schedule; 2) shows up on time; 3) lets coaches do their jobs; 4) shouts only positive encouragement to the team but firmly disciplines his or her own child; and 5) brings enough for everyone. 
ASO: Actual Singles and Outs. Plays in a tee-ball game that are recognizable as baseball events: line drives through the infield in which the player remembers to run to first and not to grandpa, 4-3 or 1-3 groundouts, and … that's about it. Tee-ball games average 1.333 ASOs per game. Parents are obligated to respond to each ASO by shouting: "Great job, Tyler! That looked like a real baseball play!" This praise tacitly reminds the children that everything they did before and after that moment disappointed their parents, undermining everything the parents hoped to accomplish with youth athletics.
CAI: Chase Assertiveness Index. Multiply the time in seconds it takes a child to chase a ball that has rolled into the outfield by the number of teammates he or she knocks over along the way; then multiply by the time in seconds the child spends telling the other kids in the outfield pileup that he or she "won" by getting the ball first. Finally, divide by the number of parents yelling "throw it in!" Ignore CAI for any child under seven who stops and waits for a cutoff throw; apply immediately for a baseball scholarship instead.
CER: Catcher's Equipment Resources. The time and manpower needed to properly equip a catcher under eight years old. The national CER average is 42.67 coach-minutes. For teams with only one coach, it is best to start putting the catcher's equipment on approximately three minutes before he or she removes it.
DAR: Dandelions Above Replacement. The replacement-level tee-baller picks 2.5 dandelions per half-inning. A lower total indicates that a child is either advanced enough to pay attention to the game or afraid of all the bees. Truly advanced tee-ballers pick violets only (VORP).
GLR: Game Length Relativity. The time it takes to play a youth league game starts at one hour and is adjusted by the following equations: 1) Add five minutes for every degree Fahrenheit above 75 at first pitch. 2) Add 10 minutes for every degree Fahrenheit below 55 at first pitch. 3) Add 20 minutes for every inning left in the game after 7:30 p.m. 4) Add 30 minutes for every coach on either side who still brings up his double in the 1988 tri-county championship game in casual conversation.
Lineup Optimization. The optimal youth league lineup, handed down from coaching generation to generation. 1) Skinny kid. 2) Kid who can actually play. 3) Coach's kid. 4) Lawyer's or mayor's kid. 5) Attractive divorced mom's kid. 6) Chubby kid. 7) Kid who cannot play but will cry if batting last. 8) Brainy kid who will grow into resentful sportswriter. 9) Kid who always shows up late, when the scorecard is already filled out.  
OK Computer: A complex algorithm for determining what affect the percentage of "Older Kids" has on any league. As parents realize that their children can excel at sports if they are a year older than the other players, an increasing number of OKs will enter a given league as parents ask for special exceptions. Haphazard enforcement of age limits can result in escalation practices, which result in coach-pitch level players who win county championships but also shave.
Ironically, if the OK Computer reaches 100 percent in any league, a state of equilibrium occurs. Not only are all of the participants roughly the same age, but they actually are developmentally ready for the tasks they are asked to perform. (As opposed to the current situation, with tee-ballers eating infield dirt and nine-year old pitchers trying to reach the strike zone 75 times per game, three games per week.) A powerful force prevents the OK Computer from ever reaching 100 percent, however: the angry screed about the league president on Facebook.
PE/EC: Parental Expectation to Equipment Cost Ratio. Handy for determining which parent will be first to  tell the coach that his 5-year-old has a wicked slider: It's the one whose kid is rolling a $219 DingerXL bat bag behind him. Any parent whose child shows up with two $249 Demarini Cf5 bats will demand that base-stealing be included in tee ball.
-1 Theory: The Inverse Participation Theory. Applies to 7-to-9-year-old leagues, in which score is kept despite the fact that most kids are still watching airplanes pass overhead. The P -1 Theory states that the fewer members of any team's roster participating in a given game, the more likely that team is to win. The P -1 theory works because children who are awful at baseball (and their parents) tend to deprioritize showing up for games regularly; whether this is cause, effect or vicious cycle in not relevant. Since everyone bats at this level, three kids opting for cello practice instead of a game results in nine fewer strikeouts and obligatory infield innings for the shorthanded team.
If you are sitting on the bleachers and a parent tells you something to the effect of, "I am jealous of just how wonderful your child is at playing the cello," you may be raising the next Yo-Yo Ma, but it is more likely that parent is trying to "game" the P -1 Theory.
Reaction time. Time it takes for a tee-baller to stop drawing in the dirt and recognize that a ball has just rolled past him. Measured in paleontological epochs.
SBS%: Swinging Bunt Success Percentage. Applies to under-10 leagues. The SBS% analyzes the inverse relationship between the distance a hit ball travels and the value of the play. A ball that rolls 15 feet in front of the catcher usually results in overthrows at first, second and third base, yielding an inside-the-park home run, while a sharp grounder to the shortstop (the kid who knows what he is doing) is a possible ground out. The higher the SBS%, the more important it is for coaches to limit the number of extra bases runners can take, but they never do.
Total Average. A grand unification equation that normalizes and weighs such variables as childhood delight, lifelong memories, fresh air, skill development and character building against equipment expenses, skinned knees, lost batting gloves, having to volunteer at the snack stand, hurt feelings when Cameron calls Ethan a poopie head for missing a ground ball, and angry shouting matches with Cameron's parents. When total average stays positive, youth baseball is an invaluable bonding experience. When it drops below zero, consider soccer or drama camp instead.
TPar: That Parent. You know the one. Don't be him or her.
'via Blog this'

Giants Top Minor League Prospects

  • 1. Joey Bart 6-2, 215 C Power arm and a power bat, playing a premium defensive position. Good catch and throw skills.
  • 2. Heliot Ramos 6-2, 185 OF Potential high-ceiling player the Giants have been looking for. Great bat speed, early returns were impressive.
  • 3. Chris Shaw 6-3. 230 1B Lefty power bat, limited defensively to 1B, Matt Adams comp?
  • 4. Tyler Beede 6-4, 215 RHP from Vanderbilt projects as top of the rotation starter when he works out his command/control issues. When he misses, he misses by a bunch.
  • 5. Stephen Duggar 6-1, 170 CF Another toolsy, under-achieving OF in the Gary Brown mold, hoping for better results.
  • 6. Sandro Fabian 6-0, 180 OF Dominican signee from 2014, shows some pop in his bat. Below average arm and lack of speed should push him towards LF.
  • 7. Aramis Garcia 6-2, 220 C from Florida INTL projects as a good bat behind the dish with enough defensive skill to play there long-term
  • 8. Heath Quinn 6-2, 190 OF Strong hitter, makes contact with improving approach at the plate. Returns from hamate bone injury.
  • 9. Garrett Williams 6-1, 205 LHP Former Oklahoma standout, Giants prototype, low-ceiling, high-floor prospect.
  • 10. Shaun Anderson 6-4, 225 RHP Large frame, 3.36 K/BB rate. Can start or relieve
  • 11. Jacob Gonzalez 6-3, 190 3B Good pedigree, impressive bat for HS prospect.
  • 12. Seth Corry 6-2 195 LHP Highly regard HS pick. Was mentioned as possible chip in high profile trades.
  • 13. C.J. Hinojosa 5-10, 175 SS Scrappy IF prospect in the mold of Kelby Tomlinson, just gets it done.
  • 14. Garett Cave 6-4, 200 RHP He misses a lot of bats and at times, the plate. 13 K/9 an 5 B/9. Wild thing.

2019 MLB Draft - Top HS Draft Prospects

  • 1. Bobby Witt, Jr. 6-1,185 SS Colleyville Heritage HS (TX) Oklahoma commit. Outstanding defensive SS who can hit. 6.4 speed in 60 yd. Touched 97 on mound. Son of former major leaguer. Five tool potential.
  • 2. Riley Greene 6-2, 190 OF Haggerty HS (FL) Florida commit.Best HS hitting prospect. LH bat with good eye, plate discipline and developing power.
  • 3. C.J. Abrams 6-2, 180 SS Blessed Trinity HS (GA) High-ceiling athlete. 70 speed with plus arm. Hitting needs to develop as he matures. Alabama commit.
  • 4. Reece Hinds 6-4, 210 SS Niceville HS (FL) Power bat, committed to LSU. Plus arm, solid enough bat to move to 3B down the road. 98MPH arm.
  • 5. Daniel Espino 6-3, 200 RHP Georgia Premier Academy (GA) LSU commit. Touches 98 on FB with wipe out SL.

2019 MLB Draft - Top College Draft Prospects

  • 1. Adley Rutschman C Oregon State Plus defender with great arm. Excellent receiver plus a switch hitter with some pop in the bat.
  • 2. Shea Langliers C Baylor Excelent throw and catch skills with good pop time. Quick bat, uses all fields approach with some pop.
  • 3. Zack Thompson 6-2 LHP Kentucky Missed time with an elbow issue. FB up to 95 with plenty of secondary stuff.
  • 4. Matt Wallner 6-5 OF Southern Miss Run producing bat plus mid to upper 90's FB closer. Power bat from the left side, athletic for size.
  • 5. Nick Lodolo LHP TCU Tall LHP, 95MPH FB and solid breaking stuff.