Showing posts with label LAUNCH ANGLE. Show all posts

Tuesday, June 26, 2018

What is Happening with the 2018 Home Runs? | Exploring Baseball Data with R

What is Happening with the 2018 Home Runs? | Exploring Baseball Data with R

What is Happening with the 2018 Home Runs?

MLB Report on Home Run Hitting

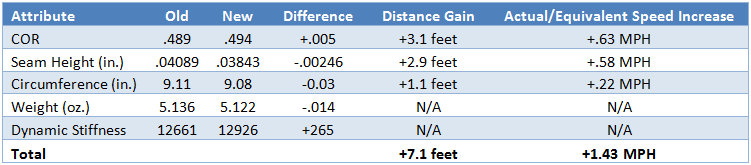
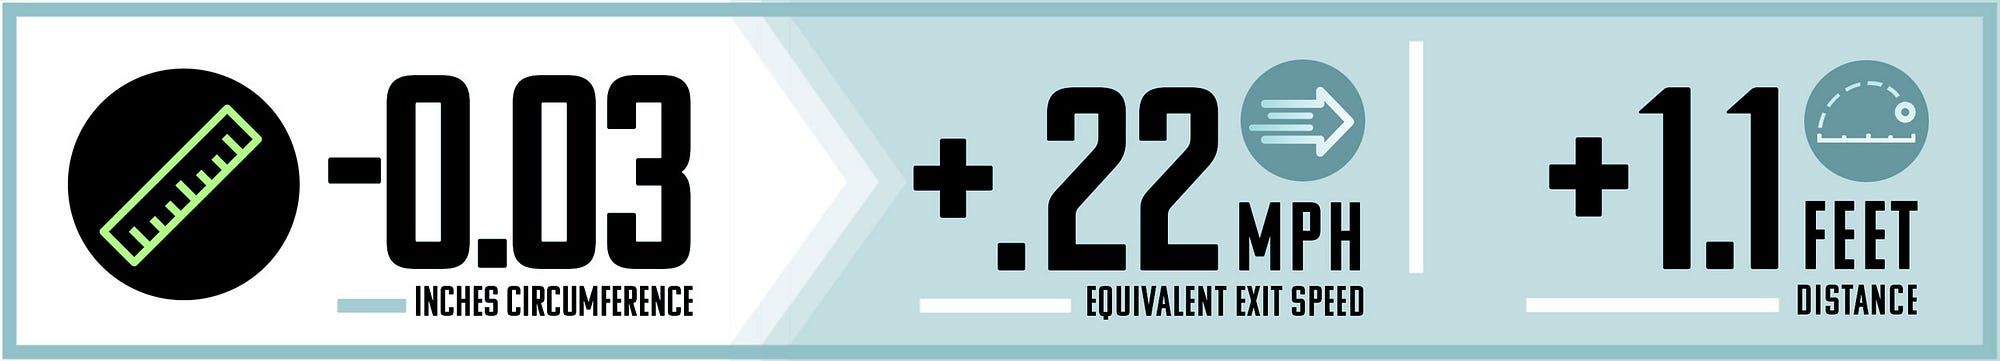
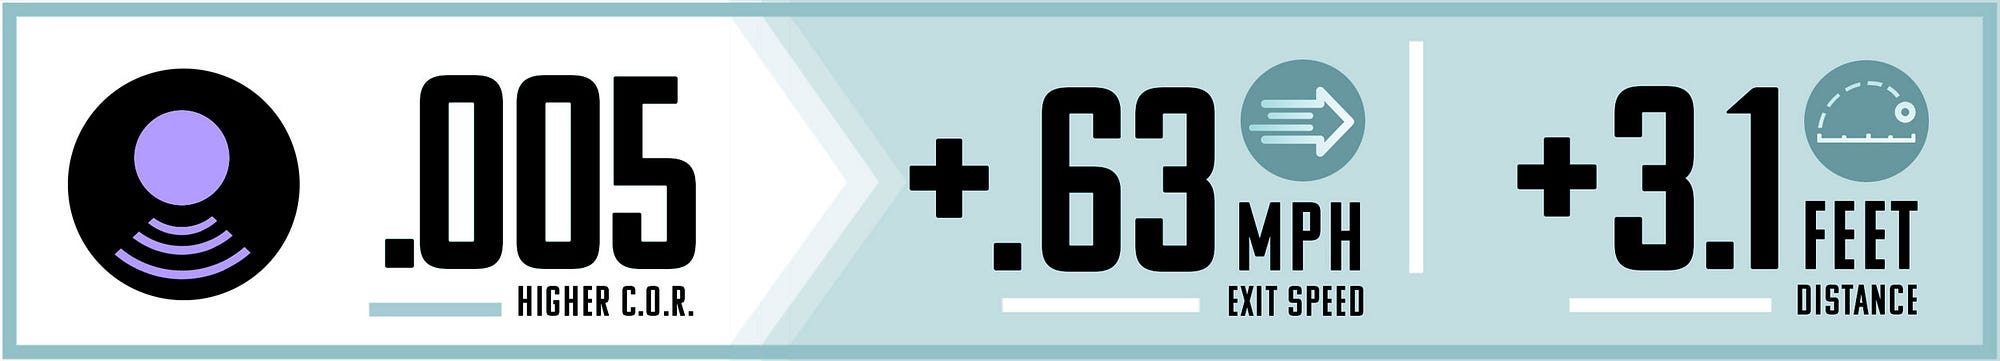
Last week, Major League Baseball released a report by a scientific committee (including me) that explored the recent increase in home run hitting.    I encourage you to read our report.  One main conclusion was that the 2017 increase in home run hitting was not due to a change in launch angles or exit velocity, but rather a reduction in the drag that results in better carry of the ball.  Given that report, it is interesting to explore what is happening in the 2018 season (through games of May 27).  Are we seeing a similar carry in the balls as we saw in 2017?  I'll perform a brief exploration here.

Home Run Hitting:  2017 and 2018

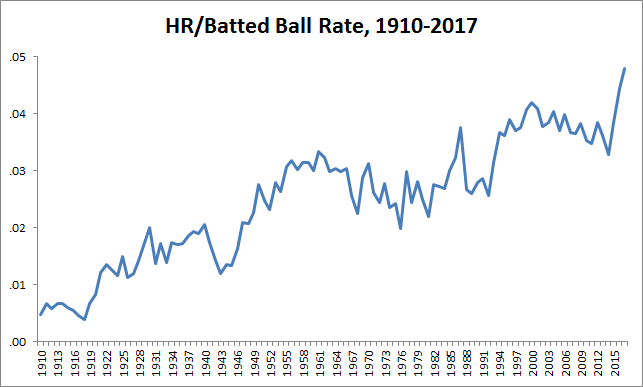
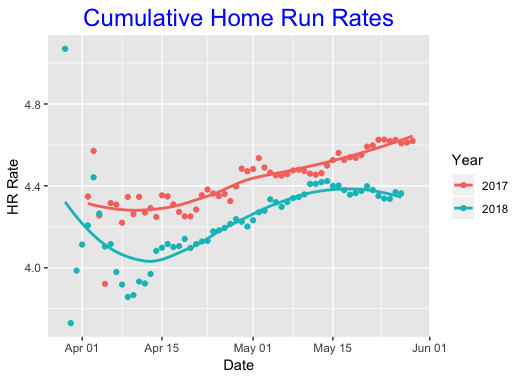
The first observation is that there is a significant drop in home run hitting this season.   Below I plot the cumulative rate of home runs on balls in play as a function of the date.  Clearly there is a cold-weather effect — the rate of hitting home runs tends to increase through the season — but the 2018 rate is trailing the 2017 rate.  Currently the 2018 rate is under 4.4 % — the 2017 rate at the end of May is about 4.6 %.
may27hr.png

Change in Launch Speed and Launch Angle?

Okay, maybe there is a drop in the home run rate due to a change in launch angle or launch velocity.  For each season below, I compute the median launch angle (LA), launch speed (LS) and proportion of batted balls hit in the "red zone" (this is a region of the LA, LS space where most of the home runs are hit).  Interesting, 2018 batters are hitting balls at a higher launch angle, higher launch speed, and a higher rate of balls hit in the red zone.  On the basis of these statistics, I'd expect an increase, not a decrease in the home run rate.

Year LA LS P
2016 10.7 89.7 0.180
2017 11.4 89.2 0.183
2018 12.2 90.2 0.194

Home Run Prediction Based on 2017 and 2016 Model Fits

We know there is a strong relationship between the launch angle, launch speed, and occurrence of home runs.  Given the launch angle and launch speed, I fit a generalized additive model that predicts the probability of a home run.  I fit two models — one to data from the complete 2016 season and a second to data from the complete 2017 season.  Using these models, I can predict the number of home runs hit in the 2018 season (through May 27) using the observed launch angles and launch velocities.  

Here is what I found:

Using 2017 model, I predict there would be 2294 home runs.
Using 2016 model, I predict there would be 2110 home runs.

We've only observed 1759 home runs (through May 27) — this is 500 home runs lower than I would be predict using the 2017 model that predicts home runs on the basis of launch speed and launch angles.  So really the drop in home run hitting that we see in the above graph really is conservative — if we adjust for the actual launch angles and launch speeds, the drop is lower.

Reduced Carry

One way of looking at the 2018 season change is to focus on the probability of a home run given specific values of the launch angle and exit velocity.  Let's focus on the values Launch Angle = 30 degrees, Launch Speed = 100 mpg — these values are in the red zone where there is a good probability of a home run.  Here are the probabilities of hitting a home run using models fit to the 2018, 2017 and 2016 seasons:

2018 2017 2016
0.409 0.568 0.502

Here are the home run probabilities using data from only the first part of the baseball season (through late May)

2018 2017 2016
0.409 0.481 0.420

Note that the 2018 estimated probabilities are significantly lower than the 2017 values, even when you adjust for the early part of the season.  In other words, the balls with a particular launch angle and launch speed are experiencing more drag in 2018, at least relative to 2017.

Summing Up

Home run hitting is fascinating to explore since there are potentially many variables including the hitter, the pitcher, the baseball, the weather, ballpark, etc that affect home run production.  There is clearly a decrease in home run hitting in 2018 and balls hit with specific launch angles and launch speeds are less likely to be home runs.  As I noticed, 2018 hitters are actually hitting with higher launch angles and higher launch speeds, but the balls appear to have more drag.  Of course, the big question is why this is happening, and this motivates further exploration.

Added May 29

It is very possible that this home run drop is due to the colder temperatures in 2018.  

Michel Lichtman tweets:

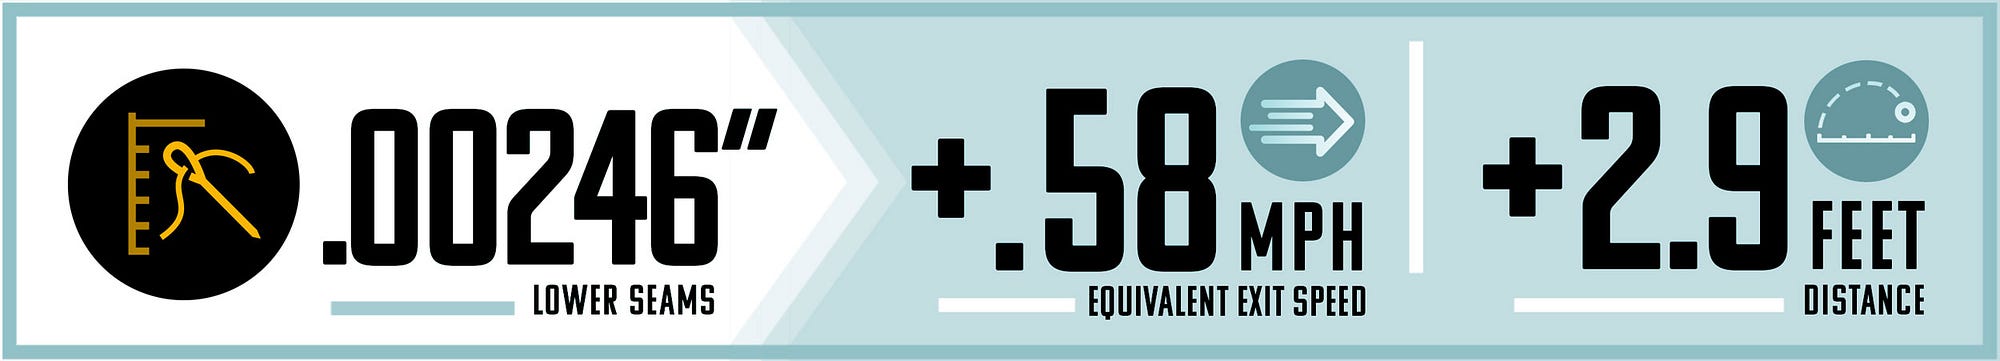
Through May 12 the average temperature at all MLB stadiums in 2018 was 62.7 degrees F. In 2017, it was 65.8, a difference of 3.1 degrees. Plugging those numbers into Dr. Nathan's trajectory calculator those 3.1 extra degrees in 2017 yields a 1.1 foot extra carry on a 100/30 ball.

The suggestion is that the temperature could explain the drop in 2018 home run production

Sent from my iPhone

Monday, June 25, 2018

Using Swing Plane to Coach Hitters: a Deeper Look - Driveline Baseball


What has changed from Ted Williams' day is we now have the technology to measure the matching of the hitters swing plane to the angle of incoming pitch. That's it, folks.

from drivelinebaseball.com
https://www.drivelinebaseball.com/2018/05/using-swing-plane-coach-hitters-deeper-look/

Swing plane is a commonly used, and certainly not a new, idea. Ted Williams famously discusses it in his book The Science of Hitting in 1971 and includes this awesome graphic. Swing plane is incredibly important, but the swing plane problem is much more complex than how it’s being discussed.

Same is in pitching where we now have better tools to measure a pitchers velocity than we did back in Williams day where we measured Bob Fellers fastball by running a motorcycle with a speedometer on a track next to Feller throwing a ball. Real precise measurement tool back then.

BTW, pitchers may not be throwing harder than back in the day as we need to adjust for the inadequacy of the tools being used to measure the speed which reduced the speed number by anywhere from 3-5 MPH. There are certainly more pitchers throwing harder since these days the pitching gurus are entirely focused on throwing harder whereas back in the day the "pitching guru wars" focused on how to throw more efficiently i.e.: with "perfect mechanics".  The focus has shifted.

The advancement in technology has led to a regression in the value, worth and efficiency of most modern day baseball gurus in my opinion, but only time will tell.


Friday, June 08, 2018

Launch Angle vs. Exit Angle | Inside Pitch Magazine

Launch Angle vs. Exit Angle | Inside Pitch Magazine


The Precise Point Hitting Mat is a tool hitters can use to practice optimal exit angle based on pitch location.

I get that everyone is blinded by recency bias, I still trust Ted Williams and Mike Epstein for that matter, for being pioneers in the "launch angle" revolution. 


Image result for ted williams launch angleImage result for ted williams launch angle


from insidepitchonline.com
https://insidepitchonline.com/exitangle/

Launch Angle vs. Exit Angle


by Rob Ledington, Head Baseball Coach, Lynn Camp (KY) HSOver the past few years, there's been a great deal of discussion regarding the value of launch angles and offensive production, particularly as it relates to home runs, extra base hits, and runs batted in. The increased attention most likely contributed to the single-season home run record set by Major League Baseball this past season. However, does this information alone suggest that every hitter should increase their launch angle? The obvious answer is no.

A physical player with power and below average speed would obviously benefit from hitting home runs or balls in the gap for increased offensive productivity. These types of players are those who can most benefit from working on developing a higher launch angle. On the other hand, a smaller player with little power and superior speed would benefit from a lower launch angle, with their goal focused on producing line drives and hard ground balls. Even a 'swinging bunt' from smaller 'speed' guys is much more beneficial than most anything hit in the air. A buy-in to this approach can greatly increase offensive productivity by providing more opportunities to get on base, utilize their speed and ultimately, score more runs, which is what the offensive game of baseball is all about.
Exit angles, however, have equal value for all hitters regardless of size, speed, and/or desired launch angle. All hitters strive to hit the ball "squarely" thus maximizing exit velocity, and in some instances carry (travel in the air), while guarding against weakly hit fly balls and ground balls. What are exit angles? How do you determine the proper exit angle for each pitch location?

Exit angles are defined as the direction the ball goes after it is put in play. More simply put, the optimal exit angle is dependent on the lead foot, the bat and the ball creating a 90-degree angle at the point of contact. When this occurs, exit velocity is maximized for the ground ball, the line drive, and the fly ball because this contact will not create sidespin. Additionally, a fly ball will travel farther in the air when combined with the proper launch angle and backspin rotation. A high launch angle with a tardy swing (less than square) will create a high fade (in golf terms), or sidespin much like a sinker (in pitching terms), producing less exit velocity and carry. Conversely, an early swing at a high launch angle will create hook spin (in golf terms), or cutter/slider spin (in baseball terms) producing less exit velocity and carry. Therefore, only the ball struck at the optimal launch angle combined with the optimal exit angle will produce maximum exit velocity and distance in the air. It should be noted that is it entirely possible to hit a ball hard without "square contact."

It is common knowledge that a four-seam fastball (with backspin) has more velocity and carry than a sinker, a cutter, or a slider. Similarly, a drive down the middle of the fairway with backspin will travel farther in the air than a fade or a hook. Thus, to maximize exit velocity and distance in the air, the launch angle and the exit angle must work together, with the exit angle having greater importance of the two. This is especially for the smaller player, unless they enjoy jogging to second base and back to the dugout!

Since the invention of the game, baseball coaches have taught their players to hit the pitch thrown down the middle of the plate back through the middle of the diamond. Ironically when this happens "square contact" occurs as it relates to the lead foot, the bat, and the ball at the point of contact. Once this central contact point has been established, it becomes possible to determine every other point of square contact, both on the inside and outside parts of the plate. For example, if the pitch is outside, coaches will say things like, "let it get deeper" or "let it travel." When the pitch is inside, you are likely to hear "hit that out in front of the plate" or "get your foot down and swing earlier." These statements are painfully obvious to everyone, but without an understanding of specifically what needs to happen to yield optimal results, making these adjustments can be a challenge.

The general rule when it comes to handling pitches closer to the edges of the plate is to allow the pitch one ball's width outside of center to travel precisely one ball's width deep of the center pitch location, or behind the lead foot. If the pitch is two balls outside, two balls deep or behind the lead foot, and finally three balls outside, three balls deep or behind the lead foot.

The same concept would apply to pitches inside of the center contact position. One ball's width in, one ball's depth in front of the lead foot, two balls in, two balls in front of the lead foot, and finally three balls in, three balls in front of the lead foot. If this occurs, the batter will create "square contact" for each pitch location, resulting in optimal or maximum contact for each pitch.

With this understanding of what 'square contact' means as it relates to pitch location, creating a feel for the best exit angle on a pitch-to-pitch basis becomes much easier. It is even possible to practice these angles: for example, if a pitch is one ball's width inside of center, the optimal exit angle is 10 degrees for a baseball and 13 degrees for a softball (angle variance attributed to the difference in diameter of the balls). Each pitch location inside and outside of center will have precise and varying exit angles that can provide players and coaches with the opportunity to set up precise targets to aim for off the tee, during soft toss, and even during live batting practice.

Providing visual targets can help your team buy in to the concept of becoming a more complete offensive player. It also gives them instant feedback, which is something that this current generation of players is finding more and more desirable.


Sent from my iPhone

Thursday, June 07, 2018

Giants Hitting Stats at a glance


Longoria OPS is .738, barely above Panik at .729. I guess I never realized what a windmill he was. He swings at everything, anything close. McCutchen at .761 is close. He doesn't expand the strike zone that much, if at all. The umpires do a pretty good job at expanding it for Andrew. 

Longoria reportedly got a bit touchy when a reporter brought up how his OBA is almost equal to his AVG, ie: he doesn't walk much and he said "Who cares about walks?" I guess he missed the whole Moneyball, Brad Pitt bro-mance that baseball has had with OBA and walks recently. Or perhaps he's more a "launch angle" guy. 

Austin Jackson OPS @ 0.622 Yuck!!

from thescore.com (app link)
https://thescore.app.link/ntEzyCn6pA

Monday, April 30, 2018

Why Every Baseball Player, Regardless of Age, Should Care About Their Launch Angle and Exit Velocity | STACK


Given that "Launch Angle" and "Exit Velocity" are the two biggest buzz words in the industry today, I figured I would get up to speed on this and some of the more advanced metrics listed above.  JK ;)

from fangraphs.com
https://www.fangraphs.com/tht/uncovering-dips/

Let’s discuss the specific coefficients for a moment. As has generally been acknowledged (most importantly by Voros himself in introducing DIPS 2.0), strikeouts and home runs serve to drive down BABIP. Why? Well, to start, both are associated with fly ball tendencies, and fly ball pitchers allow less hits on balls in play. Strikeout pitchers may also allow easier to catch batted balls because their pitches are harder to hit (and, so the theory goes, to hit well).

from STACK.com
Why Every Baseball Player, Regardless of Age, Should Care About Their Launch Angle and Exit Velocity | STACK

Launch angle.
It's a term that was barely uttered five years ago, yet it's quickly become one every modern baseball player needs to know.
Launch angle refers to the ball's vertical angle of trajectory off the bat. Anything below 0 degrees is an automatic ground ball, and advanced statistics have found ground balls to be one of least productive types of contact a hitter can make at any level. For decades, young ballplayers were told to "swing down on the ball." We know now that's a bunch of a baloney, as such a technique will likely lead to little more than groundouts, double plays and the occasional single that sneaks under an infielder's glove.
In the MLB, where we have access to all batted ball data, there's been a clear trend toward higher launch angles. In 2015, the league average launch angle was 10.1 degrees. That crept up to 10.8 degrees in 2016 and 11.1 degrees in 2017. It's likely no coincidence there were 6,105 total home runs hit last season, smashing the previous league-high of 5,693 from the year 2000.
Many have referred to this trend as the "fly ball revolution," but it might be more accurate to dub it the "ground ball revolt." The best teams are teaching their players to abhor ground balls and the launch angles associated with them. Inside the Los Angeles Dodgers' practice facilities, you'll find a sign that says "No Ground Balls Ever." At the University of Iowa, players take batting practice in front of a wall of nets which span from third base to first base. This "Wall of Launch Angles" helps the players focus on driving the ball over the nets, as opposed to blasting grounders into them.
So if a launch angle under 0 is not ideal, what is? Well, any launch angle under 10 degrees isn't going to have a great shot of being an extra base hit, and any launch angle over 35 degrees is likely to be a sky-high fly ball easily tracked down by an outfielder. A launch angle between 10 and 25 degrees seems to be most fruitful, as it's a meaty trajectory that results in a high percentage of not only hits, but extra base hits. For pro hitters who can smoke the ball, the top end of that range is a bit higher. But launch angle is only half of the equation in this data-driven hitting revolution—the other being exit velocity. That refers to how fast the ball comes off, or exits, the bat. Being able to pair a high exit velocity with the right launch angle on a consistent basis is key to being a productive hitter. The average exit velocity for high school players is about 75 mph, while elite high school players often hover around 90. A player with an optimal or near-optimal average launch angle but a poor average exit velocity isn't going to be a great hitter, nor is one with a great average exit velocity but a poor average launch angle.
"Even just a few years ago, no one talked about launch angle or exit velocity or spin rate of a pitch. Now, even at the youth level, it's going down into the academies. Colleges are starting to ask 'what's a kid's exit velocity or what's his spin rate?' All that data is really quantifiable and it's a great measuring tool for evaluation," says David Mayberry, a Baseball Application Specialist for FlightScope.
FlightScope is the company collecting much of the data players and coaches now use to inform their swings. The technology actually has roots in the defense industry, where it was first used for missile tracking beginning in 1989. Thirty countries still rely on FlightScope for missile tracking data, but the tech has since crossed over into sport.
After making inroads in cricket, golf and tennis, the tech came to baseball and softball about three years ago. It's since been a revelation for many pro and collegiate teams. The unit used in baseball, which is known as the FlightScope Strike, relies on 3D Doppler radar to track the full flight of a projectile. "It's sending out microwave signals, and then with the Doppler effect and the disturbance in the frequencies, we're able to detect the full flight of a projectile—whether it's a missile or a pitched or batted baseball," Mayberry says.
The unit utilizes a built-in camera and Wi-Fi hotspot to easily display data on a tablet such as an iPad or Microsoft Surface. Its flexible mounting allows it to be deployed in about any game or practice situation you can imagine, including indoor batting cages. Once the unit is up and running, it collects data with no need for additional human input. The sheer number of metrics it can collect is astonishing:

At $18,000 a unit, the FlightScope Strike isn't cheap. However, the number of college and pro teams who have invested in the technology are a testament to its value. The New York Yankees own three units solely for the purpose of scouting, and have deployed them in Venezuela and the Dominican Republic in an effort to identify the next international star. The Philadelphia Phillies plan to roll out the units at every level of their organization. Stanford, Illinois, Arkansas and Bucknell are among the collegiate teams looking to gain an edge with FlightScope.
While the highest levels of baseball make use of most (if not all) the metrics collected by FlightScope, it's launch angle and exit velocity that have the most universal appeal and application. Showing ballplayers a 3D representation of their hit trajectory, exit velocity and launch angle on a tablet results in quick comprehension and a vested interest regardless of age.
"Everybody's a visual learner these days, so when they can actually see the shape and trace of their hit, it becomes a part of their approach," Mayberry says. "Even in the youth level, 14-U and into high school, the players—when they see this data, they're visual learners and they're really engaged. The engagement factor is huge when it's on a screen—a lot of players tune out verbal cues or authoritative figures. But when it's on a screen, they're really engaged and taking ownership."
The data gives purpose to practice. While a ball hit off the back of the batting cage used to be lauded as a great piece of hitting, we now know that it's likely to result in a ground ball. Technology like the FlightScope takes the guess work out of it and allows players to see, feel and repeat the type of contact they want to be making.
"Traditionally, if a baseball player was training in a cage, a hard hit ball off the back of the cage was commendable. When it really shouldn't have been. That's a launch angle of 0 degrees—it's coming out straight. That's a ground ball. No matter how strong you are, if you hit if off the back of the cage at 0 degrees, that's a grounder," Mayberry says.
Access to this data can also help better inform a player's sports performance training. If they see their average exit velocity and launch angle are improving over time, they can have confidence the work they're putting in in the weight room is translating to better functional strength, improved hand-eye coordination and harder contact.
"I use this term cause and effect. You can make adjustments and see the real-time effects. If you're working on your ground reaction forces, how much force you're putting into the ground, you can immediately see what effect that has on your average launch angle, exit velocity, batted ball direction. Same thing if you're a pitcher, your velocity and spin rate. Then you can check your biomechanics. If you're doing a certain type of movement, and you're getting better torque from your hip and shoulder separation, then you can see the immediate cause and effect in real time," Mayberry says.

The data can also be a valuable gauge for recovery—if a player is sitting at a significantly lower exit velocity than they're used to, perhaps they need to examine their recent habits. How much sleep have they been getting? What kind of foods have they been eating? Are they overtraining and need to ease up a bit? Feeling sluggish was not something easily quantifiable for baseball players in the past, but that no longer has to be the case.
While this data is still fairly new in the world of baseball, teams have quickly learned that it has tremendous value. Although traditional stats like batting average or extra base hits can be skewed by factors like level of competition, luck, field dimensions, etc., these metrics do not lie. If a kid has an impressive average exit velocity and an efficient average launch angle, college and pro scouts know those skills are likely to translate to the next level. "Everything's evolving as we speak. I was talking to a youth academy located in South Carolina, and they said Clemson and the University of South Carolina are reaching out and asking about a 14-year-old player's exit velocity. So it's becoming a requirement," Mayberry says.
Mayberry believes that even T-ball players aren't too young to be thinking about their average exit velocity and launch angle. Because at the end of the day, those two metrics are what determine how hard and how far you're going to hit the ball. Focusing on those two factors can help a young ballplayer build a powerful, athletic swing. "Ground balls should be getting out of their vocabulary. Maybe they'll hit it too high at first, but then they can zero in and bring (that launch angle) down," Mayberry says. "All of this rolls up to a better understanding for the player. They're taking ownership and they're being more accountable for their own success."
Photo Credit: Icon Sportswire/Getty Images


'via Blog this'

Tuesday, April 17, 2018

6-9, dudes! - McCovey Chronicles


Let's do the math.
6-9 = .400 ball.
  • .400 ball = 65-97 final record
  • 65-97 record = zero improvement over last year. 
  • Zero Improvement over last year = UNACCEPTABLE!!
from McCovey Chronicles:
Chroncast #76: 6-9, dudes! - McCovey Chronicles:
Yes, the Belt Wars get some play in this week’s episode, which is admittedly not the most topical discussion to have, but still feels pretty relevant to the first 3 weeks of the regular season. But rather than watch pitches go by, we take a swing at other topics including: did the Giants make a mistake sticking with Beede over Suarez? Is Mac Williamson simply too good to be on the Giants? Is the definitive Josh Osich the one we’re seeing now? We also tackle your Twitter questions.
'via Blog this'
  • OK, Longoria and McCutcheon aren't going anywhere. 
  • OK, Pence goes down to AAA, Williamson goes to AAAA or LF, whatever. 
  • Whoever authorized keeping Beede over Suarez needs their head examined. 
  • Whoever still sees something in Osich also needs their head examined. 
Belt is the least of the Giants many problems right now, although he has Joey Votto-itis minus the production. Swing the bat once in a while, you're not Ted Williams and the Moneyball - OBA love fest is over, replaced by exit velo and launch angle.

You get neither with the bat on your shoulders.

Oh, and fire Hensley Meulens, please.


Wednesday, March 21, 2018

New study links changes to the baseball to the record number of home runs in MLB - CBSSports.com

juiced_coresplitpair_silo-2

Yeah, I know. Been saying it for a while now, welcome to the party. Launch angles my butt.

It's what they did to get fans back after cancelling the World Series in 1994. And please don't tell me MLB didn't know about the performance variations inherent in their ball specifications. It's called plausible deniability. 

from CBSSports.com
New study links changes to the baseball to the record number of home runs in MLB - CBSSports.com:

"This is why people are wondering whether MLB is using a juiced baseball these days ...
SEASON HOME RUNS PER TEAM, PER GAME
2017 1.26
2016 1.16
2015 1.01
2014 0.86
That's a steep upward trend when it comes to home runs on a league-wide basis. As well, that 1.26 figure from last season is an all-time record by a wide margin (breaking the 1.17 mark in 2000).
Part of what's going on is a widespread emphasis among hitters on elevating the ball via an increased launch angle. A bigger factor, however, appears to be structural changes to the baseball itself. The seams may be lower and tighter, and the ball may be bouncier and -- to hear some World Series participants tell it -- slicker.
MLB has countered that the contemporary baseball still falls within the normal ranges when it comes to official specs. Part of the issue, though, is that those normal ranges are fairly sprawling. In other words, two balls can satisfy those criteria and behave quite differently off the bat. "
'via Blog this'

Friday, February 16, 2018

Neuroscience Can Project On-Base Percentages Now | FanGraphs Baseball


Image result for Neuroscience Can Project On-Base Percentages Now | FanGraphs Baseball

Once this type of data can be incorporated into scouting and player development, there will be less draft mistakes and better hitters. 

Subject: Neuroscience Can Project On-Base Percentages Now | FanGraphs Baseball

from fangraphs.com
Neuroscience Can Project On-Base Percentages Now | FanGraphs Baseball

Neuroscience Can Project On-Base Percentages Now

I have an early, hazy memory of Benito Santiago explaining to a reporter the approach that had led to his game-winning hit moments earlier. "I see the ball, I hit it hard," said Santiago in his deep accent. From which game, in what year, I can't remember. Also, it isn't really important: it's a line we've heard before. Nevertheless, it contains multitudes.

We know, for example, that major-league hitters have to see well to hit well. Recent research at Duke University has once again made explicit the link between eye sight, motor control, and baseball outcomes. This time, though, they've split out some of the skills involved, and it turns out that Santiago's deceptively simple description involves nuanced levels of neuromotor activity, each predictive of different aspects of a hitter's abilities. Will our developing knowledge about those different skills help us better sort young athletes, or better develop them? That part's to be determined.
A team of researchers spread across Duke ran baseball players from two full professional organizations through a battery of nine tests on Nike Sensory Stations to measure different aspects of a player's sensory motor abilities. After creating something similar to Major League Equivalency lines for each player, the researchers were able to test the effect of each of the scores against real-life baseball outcomes.
"If you have a 23-year-old, completely average outfielder, the model predicts that his on-base percentage in the major leagues would be .292," explains Kyle Burris, one of the researchers on the project. "The model would expect a similar player who scores one standard deviation higher on the perception span task to have an OBP of .300."
The high-level, easy takeaway from their study is that these skills, taken as a whole, are predictive of good plate discipline. There was no link to slugging percentage, though, so we're not quite yet predicting full batting lines from your neuromotor scores.
But if you drill down a bit into these new findings, you'll see that there is a great deal here to get excited about. Here's a profound image that shows how each subsection of the larger skill set was linked to baseball outcomes. Darker colors denote a stronger relationship between the skill and the baseball statistic.
A table of findings reprinted with permission from Kyle Burris, Kelly Vittetoe, Benjamin Ramger, Sunith Suresh, Surya T. Tokdar, Jerome P. Reiter & L. Gregory Appelbaum "Sensorimotor abilities predict on-field performance in professional baseball" in Scientific ReportsTake a look at the row labeled "perception span," in particular, and you find an interesting story. That task was linked to good on-base percentages and strikeout rates, but not necessarily good walk rates.
"It's kind of like a game of Simon," says Burris as he tries to explain the perception-span task, "but for a split second, it gives you shapes that appear in various aspects of your peripheral vision, and you have to determine was there a square there, or a pentagon there, and it flashed at you in a split second and you have to try and remember what the shape was."
When we asked players what they see when the ball is released, a good portion of the responses detailed how little is ultimately visible to the eye. And there's that study of cricket which suggests that cricket players get more from information they gather before the release of the ball than after. This finding fits right in: players who are good at noticing things on the periphery — like the way a forearm might look different on a breaking ball, or the way the body might drag on a changeup — are better at making contact.
Hidden within the other differences between the tasks and their links to outcomes is a similar story: both the ability to suss out quickly the difference between shapes seen both near and far, and also to capture a target quickly were both good for making contact. That makes sense.

But why would hand-eye coordination be better for player's walk rate than his strikeout rate?
Partly, this could be because players have to start their swing before they know if they want to swing — a requirement velocity puts upon them — and hand-eye coordination helps them to better stop that swing if the pitch is a ball.
Partly, this could be a result of the limited capacity for actually testing hand-eye coordination. The particular task linked to that number requires respondents to tap baseballs as they appear on a screen, testing how fast they can do so.
"I'm not sure that it actually goes and tests hand-eye coordination," admitted Burris, who is headed to Cleveland for a summer internship with the Indians. "There is a little bit of hand-eye coordination in that you have to see it and then immediately translate that to a motor response, but I'd say that that was almost response-time-esque."
If you look at the separate reaction-time outcomes, you'll see a similar link to walk rate, so maybe that's the key skill in taking walk. Reacting quicker.
Or there's another way to separate the skills. You could consider the first three tasks — visual clarity, contrast sensitivity, and depth perception — as "hardware." They're linked to outcomes, of course, because there's a decent part of the game that requires good eye sight. But they're the sort of thing with which you're born.
"There will never be a blind ballplayer," said co-author Gregory Appelbaum.
Those other six tasks, though? They represent the software of our neuromotor system. They represent our ability to take the visual information given to us and process it. Software is more malleable, subject to updates. Software can be changed for the better.
"There is evidence that these processes can be improved," agreed Appelbaum. "There have been demonstrations of neuroplasticity in these processes."
Appelbaum pointed to two interesting studies that pointed to the fact that our neuromotor system's software could be trained. A study from 2015 of which he was part showed that "significant learning was observed in tasks with high visuomotor control demands but not in tasks of visual sensitivity," for one.
A 2014 study at the University of California-Riverside found that actual baseball outcomes could be improved by using a "perceptual learning program." In that study, players reported improvements such as being able to see further, and having eyes that felt stronger and didn't tire as quickly.
Appelbaum is ready to find out what these visual training technologies will look like as we go forward. He's helping launch the Duke Vision Sports Center, a clinic and lab where researchers will use sensory stations, immersive reality, and more, in order to pursue this line of thinking.
When it comes to new stats coming out of Statcast, I've personally seen a change in how players assess the numbers. Early distaste has given away to curiosity, as more players — Yonder Alonso and Andrew Heaney, for example, in my own experience — now speak up at the end of interviews to ask me about launch angle, exit velocity, and how they can use that data to train and improve.
So, while the Boston Red Sox have long been using the link between neuromotor skills and baseball outcomes in their minor leagues in an effort to bring "neuroscouting" to their own organization, these new findings offer a different use for neuromotor study. Instead of sorting players, there's major potential to use these activities to develop players and get the most out of them.
There may never be a blind baseball player, sure. But that's just hardware. Let's see how we can make the most out of our favorite player's software.


Sent from my iPhone


Friday, December 29, 2017

Is The ‘Old School’ Method of Teaching Hitting Outdated?


Hi Charles

Rachel Garcia Swing Test Experiment
Recently, Rachel Garcia, an elite collegiate softball player (National Freshman of the year at UCLA) went through a simple before and after hitting analysis that I took a small part of and thought it might help to answer our question about 'Old School' teaching methods. 

Rachel added 11 MPH in Tee Exit Velocity (Tee measures 'Raw' Power - no pitch influences), from 68 MPH to 79 MPH and increased her average Launch Angle from 5.4 degrees to 9.8 degrees in one 30 minute session.  In fact, her average Exit Velocity in her 'after' round was 5 MPH higher than her top speed in the first round.  The two most important metrics in hitting, Exit Velocity and Launch Angle, both increased significantly and immediately.  An elite athlete, seemingly already firing on all cylinders, adding 14% to her Exit Velocity.  How is this possible?  

Elite performance and 'swing efficiency' are not the same things and it is possible to hit very well with slight swing inefficiencies.  We tend to look at elite players and just assume the reason they are elite is that their swing movements are perfect.  While she already had a good swing, there were some key mechanical movements that could become more efficient and thus the immediate increase. 
​​​​​​​


Tomorrow look for a year end special on the Hitting Is A Guess - Time Training and all hitting  programs combined............. 
GuessWorks, 41303 27th Street West, Palmdale, CA 93551, USA

Unsubscribe | Change Subscriber Options


Thursday, August 10, 2017

The Juiced Ball Theory Is Back


Lower seams + Less Drag = Longer Ball Flight. The  NCAA found that out. Plus it allows MLB to divert attention to "no change in COR". What they are finding out that the NCAA did not is that blisters are up, probably because MLB pitcher throw the ball more often than collegians.

Whenever they want more HR's they monkey with the ball or the strike zone. Launch angle is a ridiculous theory. If you could dial up launch angle "What coach 28 degrees, not 29 or 27?" why wouldn't just you spray line drives all over the yard and say "F- it" to grounders and fly balls"?

The Juiced Ball Is Back

New testing suggests the baseball is at least partially responsible for MLB's huge homer spike


The Juiced Ball Is Back
"The newer balls have higher CORs and lower circumferences and seam heights, which would be estimated to add an average of 7.1 feet to their distance, equivalent to the effect we would expect to stem from a 1.43 mph difference in exit speed. Although those differences don't sound enormous, Nathan has noted that "a tiny change in exit speed can lead to much larger changes in the number of home runs." Last July, he calculated that an exit-speed increase of 1.5 mph would be sufficient to explain the rise in home runs to that point, which means that the 1.43 mph effective difference that Lichtman's analysis uncovered could comport almost exactly with the initial increase in home runs. Lichtman calculates that a COR increase of this size, in this sample, falls 2.6 standard deviations from the mean, which means that it's extremely unlikely to have happened by chance."


This article is coauthored by sabermetrician Mitchel Lichtman, who also conducted the research on which it is based.


The newer balls have higher CORs and lower circumferences and seam heights, which would be estimated to add an average of 7.1 feet to their distance, equivalent to the effect we would expect to stem from a 1.43 mph difference in exit speed. Although those differences don't sound enormous, Nathan has noted that "a tiny change in exit speed can lead to much larger changes in the number of home runs." Last July, he calculated that an exit-speed increase of 1.5 mph would be sufficient to explain the rise in home runs to that point, which means that the 1.43 mph effective difference that Lichtman's analysis uncovered could comport almost exactly with the initial increase in home runs. Lichtman calculates that a COR increase of this size, in this sample, falls 2.6 standard deviations from the mean, which means that it's extremely unlikely to have happened by chance. 
With the newer balls' reduction in circumference comes a decrease in weight, although according to Robert Adair's book The Physics of Baseball, the ball's weight, independent of its other qualities, has little effect on flight distance. Similarly, while dynamic stiffness does affect the flight of balls hit by the hollow bats used in amateur ball, it doesn't play a role with the solid bats used in the big leagues. However, a dynamic-stiffness difference that large does add to the evidence of altered composition.


Giants Top Minor League Prospects

  • 1. Joey Bart 6-2, 215 C Power arm and a power bat, playing a premium defensive position. Good catch and throw skills.
  • 2. Heliot Ramos 6-2, 185 OF Potential high-ceiling player the Giants have been looking for. Great bat speed, early returns were impressive.
  • 3. Chris Shaw 6-3. 230 1B Lefty power bat, limited defensively to 1B, Matt Adams comp?
  • 4. Tyler Beede 6-4, 215 RHP from Vanderbilt projects as top of the rotation starter when he works out his command/control issues. When he misses, he misses by a bunch.
  • 5. Stephen Duggar 6-1, 170 CF Another toolsy, under-achieving OF in the Gary Brown mold, hoping for better results.
  • 6. Sandro Fabian 6-0, 180 OF Dominican signee from 2014, shows some pop in his bat. Below average arm and lack of speed should push him towards LF.
  • 7. Aramis Garcia 6-2, 220 C from Florida INTL projects as a good bat behind the dish with enough defensive skill to play there long-term
  • 8. Heath Quinn 6-2, 190 OF Strong hitter, makes contact with improving approach at the plate. Returns from hamate bone injury.
  • 9. Garrett Williams 6-1, 205 LHP Former Oklahoma standout, Giants prototype, low-ceiling, high-floor prospect.
  • 10. Shaun Anderson 6-4, 225 RHP Large frame, 3.36 K/BB rate. Can start or relieve
  • 11. Jacob Gonzalez 6-3, 190 3B Good pedigree, impressive bat for HS prospect.
  • 12. Seth Corry 6-2 195 LHP Highly regard HS pick. Was mentioned as possible chip in high profile trades.
  • 13. C.J. Hinojosa 5-10, 175 SS Scrappy IF prospect in the mold of Kelby Tomlinson, just gets it done.
  • 14. Garett Cave 6-4, 200 RHP He misses a lot of bats and at times, the plate. 13 K/9 an 5 B/9. Wild thing.

2019 MLB Draft - Top HS Draft Prospects

  • 1. Bobby Witt, Jr. 6-1,185 SS Colleyville Heritage HS (TX) Oklahoma commit. Outstanding defensive SS who can hit. 6.4 speed in 60 yd. Touched 97 on mound. Son of former major leaguer. Five tool potential.
  • 2. Riley Greene 6-2, 190 OF Haggerty HS (FL) Florida commit.Best HS hitting prospect. LH bat with good eye, plate discipline and developing power.
  • 3. C.J. Abrams 6-2, 180 SS Blessed Trinity HS (GA) High-ceiling athlete. 70 speed with plus arm. Hitting needs to develop as he matures. Alabama commit.
  • 4. Reece Hinds 6-4, 210 SS Niceville HS (FL) Power bat, committed to LSU. Plus arm, solid enough bat to move to 3B down the road. 98MPH arm.
  • 5. Daniel Espino 6-3, 200 RHP Georgia Premier Academy (GA) LSU commit. Touches 98 on FB with wipe out SL.

2019 MLB Draft - Top College Draft Prospects

  • 1. Adley Rutschman C Oregon State Plus defender with great arm. Excellent receiver plus a switch hitter with some pop in the bat.
  • 2. Shea Langliers C Baylor Excelent throw and catch skills with good pop time. Quick bat, uses all fields approach with some pop.
  • 3. Zack Thompson 6-2 LHP Kentucky Missed time with an elbow issue. FB up to 95 with plenty of secondary stuff.
  • 4. Matt Wallner 6-5 OF Southern Miss Run producing bat plus mid to upper 90's FB closer. Power bat from the left side, athletic for size.
  • 5. Nick Lodolo LHP TCU Tall LHP, 95MPH FB and solid breaking stuff.