Showing posts with label TRUE GRIT. Show all posts

Wednesday, July 30, 2014

What Young Athletes need besides 10,000 Hours of Practice


The average teacher explains complexity; the gifted teacher reveals simplicity. -- Robert Brault

The 10,000 hour theory has become the American dream for developing athletes. 
Just work hard enough and your gold medal, Hall of Fame, championship ambitions can come true. 
It is achievable, measurable and finite.

However, many athletes never quite cross the 10,000 hour finish line, and have used the scapegoat reason, "I just didn't have enough time to commit to the sport." 
Now, recent research suggests that while 10,000 hours of deliberate practice may be necessary to achieve world-class status, it may not be the only ingredient to success. (10,000 hour theory was not wrong, just over-simplified)
Celebrating its 20th anniversary this year, a research paper by Florida State professor K. Anders Ericsson, The Role of Deliberate Practice in the Acquisition of Expert Performance, has been cited in the scientific press over one thousand times earning its own HOF credentials.  The gist of it is that Ericsson visited a West Berlin music academy and interviewed violin students and their teachers.  First, he asked the students to estimate the number of structured practice hours they had endured up to age 20.  Then, he asked their teachers to divide the class into good, better and best thirds.  The correlation uncovered showed that the best students had accumulated, on average, over 10,000 hours of practice while the middle group was at about 8,000 hours and the bottom group had not reached 5,000 hours.
After checking this relationship within other groups of skilled experts, Ericsson found similar patterns of 10,000 hours of practice and concluded that innate talent or "what we're born with" had little to do with becoming an expert in any field, even sports.  With that declaration, the dream (and the practice odometer) was launched.
However, since that landmark 1993 paper, other researchers have been finding exceptions to the rule; some experts were crowned with only 3,000 hours of practice while others still had not reached the mountaintop even though they had doubled the 10,000 hour mark.
David Hambrick, associate professor of psychology at Michigan State, has been searching for the other necessary ingredients for several years.  In 2011, he and his colleague Elizabeth J. Meinz found that deliberate practice among pianists did account for almost half of the variance between experts and novices.  But in their quest to find out what else mattered to make up the other 50% of variance, they found that working memory capacity, the ability to remember a set of objects while engaged in another task, was also a significant determinant of success.
This month, Hambrick and his team released new research that looked at 14 different studies of chess and music students to find other clues to expertise.  Again, they were convinced that deliberate practice alone was not enough.
"The evidence is quite clear," he writes, "that some people do reach an elite level of performance without copious practice, while other people fail to do so despite copious practice."
It's not just any old "practice" , but deliberate practice that makes the difference.
Smart teachers adjust the old saying "practice makes perfect" into "practice makes permanent" or "perfect practice makes perfect." Indeed, practicing a skill wrong will make a person better at doing it wrong. 
Practice must be designed with quality in mind, as opposed to quantity. Two great repetitions will cause an improvement; 102 bad repetitions will not.
--- Across those chess and music studies, they found that practice explained about one third of the journey to being world class.  
--- One new factor that did emerge was starting at a young age.  Logically, someone who started training at age 7 versus 12 would have five more years of practice, but Hambrick found that even when total hours of practice were comparable, the student that started at an earlier age became more accomplished.  "This evidence suggests that there may be a critical period for acquiring complex skills just as there may be for acquiring language," he concluded.
--- Overall intelligence did make a difference, at least for these chess and music students.  Those students with a higher tested IQ, including working memory capacity, were also more likely to end up being experts.
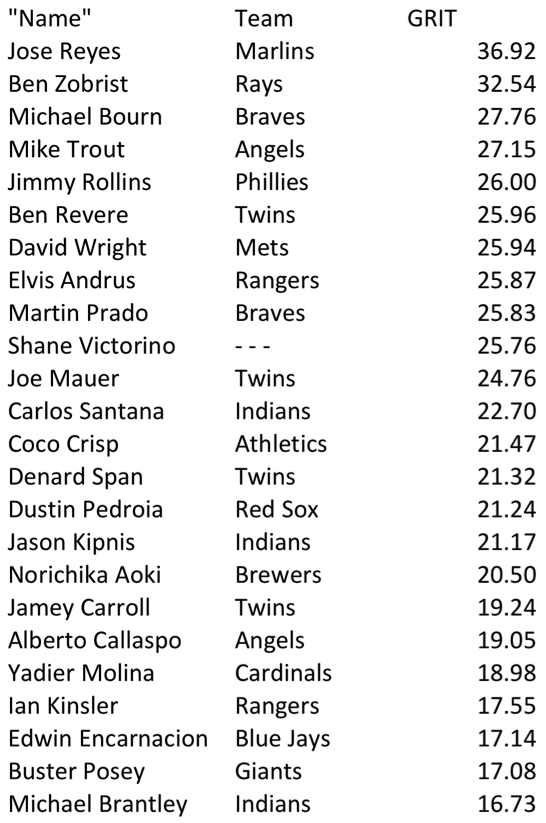
--- Finally, grit, a determined attitude to succeed, also played a role in creating success.  The term has been made famous by Paul Tough in his book How Children Succeed, based on the research of psychologist Angela Duckworth (see TED talk below).  The desire and passion to get better drives the willingness to spend so many hours practicing a skill.
So, what does all of this mean for the aspiring superstar? 
-- That practice, as much as possible, is still a necessary evil to getting better at a sport.  However, it also confirms that different athletes have different qualities and progress through their journey at different paces.
 -- They may need some guidance based on their individual strengths that will help them find the right sport. "If people are given an accurate assessment of their abilities and the likelihood of achieving certain goals given those abilities," Hambrick predicted, "they may gravitate toward domains in which they have a realistic chance of becoming an expert through deliberate practice."


Sunday, May 19, 2013

TWTW!! Maybe Hawk Harrelson has it right


After listening to the recent debate between the Hawk and ESPN's Brian Kenney (YouTube below), I couldn't help but think that maybe the Hawk has a point, maybe two. Whether you call it TWTW or GRIT or whatever, intangibles are a quality that by definition do not lend themselves to being quantified by definition, but you know them when you see them.

from thefreedictionary.com:
http://www.thefreedictionary.com/intangible
3.intangible - hard to pin down or identify; "an intangible feeling of impending disaster"
unidentifiable - impossible to identify
Some guys have that quality of making the other guys around them better. They make the total of the team greater than the sum of its parts. They are leaders and chemistry builders. And some guys are the opposite.

Winners have the intangibles!!! And like many things, you don't appreciate what you've got until after it's gone. Then you realize the hard to quantify value-added that these guys provide after they are missing from the equation. Then the team is equal to ( mediocrity ) or maybe even less than the sum of its parts ( under-achievers ).  Of course, then it's too late.

That's what Hawk is trying to explain to the geek squad here, IMO.

from The Big Lead:


The first example that came to my mind was Tim Tebow in 2011 with Denver.

Artistically, not a QB work of art.
Statistically, not a work of art.
But his teams win consistently.

It took the Jets to break the streak and that says more about the Jets than it does Tebow.  The Jets have been
a cesspool of bad personnel decisions and Tebow was supposed to come in and be the team plunger how?
By holding a clipboard?

Anyway, I thought I would take a look at the 2011 year in quarterbacking in the NFL and began with the
premise that the better the QB statistically, the better the teams record would be.

So,  I wanted to see the correlation between the ESPN total QB rating and winning.

In addition, I wanted to see if there were any examples like Tebow of QB's who violated the statistical model,
so to speak. Who won sometimes in spite of their liabilities as a QB as defined by the statistical metric.
They were "bad" QB's who just won ball games.

Here is the metric and how they determine the QB rating.

There were some interesting results (shown below).

from ESPN:

Glossary

  • * Season Leaders: On pace for 250 action plays.
  • * All-time data reflects 2008 onwards.
  • PASS EPA: Clutch-weighted expected points added on plays with pass attempts.
  • RUN EPA: Clutch-weighted expected points added through scrambles, designed rushes and fumbles/fumble returns on running plays.
  • SACK EPA: Clutch-weighted expected points added (lost) on sacks.
  • PEN EPA: Clutch-weighted expected points added on penalties.
  • TOTAL EPA: Total clutch-weighted expected points added.
  • ACT PLAYS: Plays on which the QB has a non-zero expected points contribution. Includes most plays

  • that are not handoffs.
  • QB PAR: Number of points contributed by a quarterback over the season, accounting for QBR and

  • how much he plays, above the level of a quarterback who plays very rarely and is on the fringe of the NFL.
  • QB PAA: Number of points contributed by a quarterback over the season, accounting for QBR and how much he plays, above the level of an average quarterback.
  • TOTAL QBR: Total Quarterback Rating, which values quarterback on all play types on a 0-to-100 scale.


A quick primer on the fundamentals of Total Quarterback Rating:
Scoring: 0-100, from low to high. An average QB would be at 50.
Win Probability: All QB plays are scored based on how much they contribute to a win. By determining expected point totals for almost any situation, Total QBR is able to apply points to a quarterback based on every type of play he would be involved in.
Dividing Credit: Total QBR factors in such things as overthrows, underthrows, yards after the catch and more to accurately determine how much a QB contributes to each play.
Clutch Index: How critical a certain play is based on when it happens in a game is factored into the score.

For the W-L data for each QB, I used CBS Sports NFL data. The W-L data includes only games where the
QB started and includes playoff games if the team advanced that far. (TWTW)

from CBSSports.com:


The correlation between the Total QBR and the QB winning percentage (W_Pct) as a starter was 0.64.

No surprise, the NFL is a QB driven league nowadays.

Based on this small sample, the correlation number implies that about 40% of a teams winning percentage is
derived from the play of their quarterback.


The first thing that jumps out are the names at the top of the list are WINNERS. The creme de la creme of
the NFL. Aaron Rogers, Drew Brees, Tom Brady, Tony Romo and Matt Ryan are the top five and win at
about the rate that their stellar play implies

The bottom of the list gives us Blaine Gabbert, Curtis Painter, Sam Bradford, Tim Tebow and Mark Sanchez.
Painter and Gabbert won at about the level of play their QBR would indicate. Sam Bradford seemed to just
have one of those miserable season where everything went wrong for him and his team. But Tebow and Sanchez
both out kicked their coverage so to speak.

Sanchez had a QBR of 33.6 and an W_Pct of 50.0% for a plus 16.40 score.
Tebow came in with a 29.9 QBr and a W_Pct of 61.5% for a plus 31.64 score.

The list of over-achievers, possessing dare I say TWTW, were:

John Skelton @ +39.90
Alex Smith @ +31.98
Tim Tebow @ +31.64
Mark Sanchez @ +16.40
Joe Flacco @ +12.52
Tom Brady @ +10.63
Jay Cutler @ +10.20

The interesting name on the list was Skelton who out-performed a more highly regarded QB in Kevin Kolb
( 34.4 QBR - 33.33 W_Pct) for the same Arizona Cardinal team. Apparently, Skelton may have had had
that je ne sais quoi, the TWTW that Hawk is alluding to and he was able to rally the team around him as
Tebow did the Broncos in relief of Kyle Orton.

Skelton and Tebow are interesting because they took over the same team, with the same defensive squad
and rallied them from depths to heights. That result defines what Hawk is speaking about. We're just not
certain how to identify it in advance, but we can generally spot it after the fact pretty well.

The rest of the overachiever names you can generally say had good to excellent defensive teams around
them. How much of the teams performance can be attributed to good defense and how much of the
defensive performance is aided by good QB play (keeping them off the field, playing from ahead more
often than from behind, etc.) is fodder for another post.

Hindsight and many forms of statistical analysis are always 20/20.  I think that is the Hawk's frustration
with the SABR crowd and it is well placed in some instances.

Looking at the other end of the scale, the under-achievers yields some interesting names. These guys
QBR was significantly higher than their team record for whatever reason. Maybe they were stat
gatherers and not team motivators. maybe they were on bad teams.

 Kyle Orton @ -29.80
Tony Romo @ -21.40
Josh Freeman @ -18.63
Sam Bradford @ -18.60
Carson Palmer @ -18.16
Matt Schaub @ -17.50
Cam Newton @ -17.50

Some of these guys were on good teams, with good defenses, soooooooooo.......IDK.

Lets just say I would score this one in favor of Hawk Harrelson over Brian Kenney
and Harold Reynolds by a TKO.
STOP THE FIGHT!!

And they can roll their eyes and snicker amongst themselves all they want.


TWTW
Total QBR W-L W_Pct W_Pct Diff Player
86.2    15-2 88.2%        88.24        2.04 Aaron Rodgers
84.0            14-4 77.8%        77.78       (6.22) Drew Brees
72.7       15-3 83.3%        83.33      10.63 Tom Brady
71.4      8-8 50.0%        50.00     (21.40) Tony Romo
69.1    10-6 62.5%        62.50       (6.60) Matt Ryan
67.5             5-5 50.0%        50.00     (17.50) Matt Schaub
65.5    10-6 62.5%        62.50       (3.00) Matt Stafford
64.4      7-6 53.8%        53.85     (10.55) Michael Vick
63.6    11-5 68.8%        68.75        5.15 Ben Roethlisberger
62.8      9-7 56.3%        56.25       (6.55) Matt Hasselbeck
62.7      8-8 50.0%        50.00     (12.70) Philip Rivers
62.6      4-5 44.4%        44.44     (18.16) Carson Palmer
59.8      7-3 70.0%        70.00      10.20 Jay Cutler
59.7    13-5 72.2%        72.22      12.52 Joe Flacco
59.4    12-7 54.5%        54.55       (4.85) Eli Manning
56.6      6-6 50.0%        50.00       (6.60) Matt Moore
55.0    6-10 37.5%        37.50     (17.50) Cam Newton
51.2      4-5 44.4%        44.44       (6.76) Matt Cassell
50.5    6-10 37.5%        37.50     (13.00) Ryan Fitzpatrick
49.8      1-4 20.0%        20.00     (29.80) Kyle Orton
45.8      9-7 56.3%        56.25      10.45 Andy Dalton
45.8    14-4 77.8%        77.78      31.98 Alex Smith
45.3    4-11 26.7%        26.67     (18.63) Josh Freeman
43.9      5-8 38.5%        38.46       (5.44) Rex Grossman
40.1      4-9 30.8%        30.77       (9.33) Colt McCoy
37.7      7-8 46.7%        46.67        8.97 Tarvaris Jackson
35.1      6-2 75.0%        75.00      39.90 John Skelton
34.4      3-6 33.3%        33.33       (1.07) Kevin Kolb
33.7      2-9 18.2%        18.18     (15.52) Christian Ponder
33.6      8-8 50.0%        50.00      16.40 Mark Sanchez
29.9      8-5 61.5%        61.54      31.64 Tim Tebow
28.6      1-9 10.0%        10.00     (18.60) Sam Bradford
22.5    2-12 14.3%        14.29       (8.21) Curtis Painter
20.6    4-11 26.7%        26.67        6.07 Blaine Gabbert
0.641328597   Correl OBR - W_Pct
 GUILFORD’S SUGGESTED INTERPRETATION FOR CORRELATION COEFFICIENT VALUES
Value  Interpretation
Less than .20    Less than .20 Slight, almost negligible relationship
.20 - .40  .20 - .40 Low correlation; definite but small relationship
.40 - .70  .40 - .70 Moderate correlation; substantial relationship
.70 - .90  .70 - .90 High correlation; marked relationship
.90 - 1.00  .90 – 1.00 Very high correlation; very dependable relationship

Tuesday, March 05, 2013

True “GRIT”: Quantifying the Game’s Grittiest Players and Teams. - Beyond the Box Score


Great article about a topic I obviously can relate to -- GRIT!! The formula is a tad bit complex and walks away from the old saw about gritty players doing things that don't show up in the box score. This author found a bunch of stuff that does appear. Not as much statistical relevance to winning as I might have thought, but this exercise identifies the blue-collar, lunch plate special kind of guys that most fans love to watch.

So here it goes.

Jose Reyes was a surprise at the top of the players (+) list, Buster Posey making the plus side of the list was not a surprise. I guess I may have been giving Reyes a bit of the Mutts mark down. We'll see how he does north of the border.

Curtis Granderson and Cody Ross were surprise on the (-) side of the players ledger. I would still take both in a heart beat, as well as Josh Hamilton.

Giants, Braves and Cardinals scoring high on the team ledger doesn't surprise very much. Add in the Padres, who are trying to model these organizations, and you get the perception of the NL scoring a bit higher than the AL in general in this area.

The Twins, Angels, Yankees and Rays lead the AL. with the Yankees and Angels maybe a bit of  a head turner. Sort of belies the perception of the corporate, white collar type image for both that a mega payroll implies. A bit of the anti-GRIT perhaps?

Interesting exercise and results from the data.  

from Beyond the Box Score:
True “GRIT”: Quantifying the Game’s Grittiest Players and Teams. - Beyond the Box Score:

The GRIT formula

To quantify GRIT I took a population of 948 hitters with at least 350 at bats since 2009. I then weighted the above-listed stats by their correlation to WAR. This coefficient which would act as a weight on the differential of each stat and the league average total, to answer our question:

Does "GRIT" equate to wins?

The formula derived is as follows:
"GRIT" = (0.309)*((SB-lgAVG(SB))+(0.389)*((Fld+Pos)-lgAVG(Fld+Pos))+(0.0319)*((Contact%-lgAVG (Contact%))+(0.5123)*((BB - lgAVG(BB))-(0.2117)*((K -lgAVG(K))+(0.0466)*((SF+SH)-lgAVG(SF+SH))+(0.104)*((IFH+BUH+BU)-lgAVG(IFH+BUH+BU))+(0.283)*((BsR-lgAVG(BsR))+(0.363))"

'via Blog this'


The basic premise:
Do the metrics we associate with grit provide value for that player overall. In other words, how much of a player's overall worth (WAR) is attributed to the value he provides through his "grit"?
I have summarized my idea of a gritty player to be as follows, with the correlating stat in parenthesis:
1) A player steals his share of bases.(SB)
2) A player that can field his position. (Fld+Pos)
3) A player that makes a lot of contact. (Contact %)
4) A player who has a high walk to strikeout ratio. (BB-K)
5) A player who has a good amount of sacrifice hits and flies. (SH+SF)
6) A player that shows best effort by accumulating infield hits. (IFH)
7) A player that sacrifice bunts + bunts for hits. (BU+BUH)

The results by player:


With that being settled, let us check out the 2012 top 25 scrappiest players according to GRIT score. These players will be statistical representations of the grittiest player by our quantifiable means:
Untitled_medium 

And the 25 least gritty players acceding by GRIT score:
Untitled_medium


Untitled_medium

Does it translate into Wins?:


And now for the final findings on our big question: Does GRIT = wins? For individual GRIT and its correlation to the player’s WAR, I have pegged the correlation of determination to be R^2 = 0.335. In doing so, I have determined that over one third of a player’s value in terms of WAR can be explained through GRIT, which is not terribly high but still statistically relevant.
Comprehensive team WAR and its correlation to GRIT is pegged closer to 40%, a R^2 = 0.373. In short, GRIT does not account for the majority of a team or player’s value but is nonetheless a factor to consider. A team like the Diamondbacks, whose prerogative this offseason was to acquire and accumulate a team of scrappy players, like Martin Pradoand Tony Campana, while already boasting Gerardo Parra and Aaron Hill, are not necessarily wrong in doing so. However it is going to take a lot more than just the value a scrappy player bring to the table, to field a winning team. Look at the Twins who in ranked second in GRIT score in the majors and compiled only 66 wins, good for last place in the AL Central. Grit and wins do not go hand and hand, as I am sure the Twins and their fans learned the hard way in 2012. Take note Diamondbacks, I am talking to you!

Friday, January 25, 2013

There are many paths to success in baseball


Interesting article in that it identifies the scouting or talent identification approach, the Wall Street / SABR-Moneyball statistical approach and the Grit / Grinder approach (also scouting based) that locally, the White Sox have built an entire marketing campaign around.  Many paths to success indeed.

from Yahoo Sports:
Snakebitten? D'backs make peculiar decision to trade Justin Upton's 'superstar' talent - Yahoo! Sports:

What many in this age of baseball homogeneity don't quite understand is a simple principle: There is more than one way to win. One of the game's beauties is its improbability – how, say, Red Sox teams that relied so heavily on numerical analysis won two World Series in four years while half a decade later Giants teams built with a diametrically opposed baseball worldview won two titles in three years. The road in baseball is not a Frost poem. Its fork has unlimited tines.
No matter a team's philosophy, one commonality saturates winners: talent. Perhaps the Red Sox and Giants took different paths to find it, but both aimed more than anything to build the most talented team it could.  That is what makes the Arizona Diamondbacks' trade of Justin Upton on Thursday so fascinating –  the sort of thing that if successful could alter the sport's calculus and if failed could add another check mark to the assault against intangibles.
As much as any baseball team in recent memory, the Diamondbacks on Thursday publicly embraced the idea of grittiness and guts, of the inherent and unquantifiable. And in doing so, they finished a two-trade whammy over the last six weeks that has seen them ship out their two most talented players in an effort to better embody this belief.

'via Blog this'

Friday, December 14, 2012

Giants Top Minor League Prospects

  • 1. Joey Bart 6-2, 215 C Power arm and a power bat, playing a premium defensive position. Good catch and throw skills.
  • 2. Heliot Ramos 6-2, 185 OF Potential high-ceiling player the Giants have been looking for. Great bat speed, early returns were impressive.
  • 3. Chris Shaw 6-3. 230 1B Lefty power bat, limited defensively to 1B, Matt Adams comp?
  • 4. Tyler Beede 6-4, 215 RHP from Vanderbilt projects as top of the rotation starter when he works out his command/control issues. When he misses, he misses by a bunch.
  • 5. Stephen Duggar 6-1, 170 CF Another toolsy, under-achieving OF in the Gary Brown mold, hoping for better results.
  • 6. Sandro Fabian 6-0, 180 OF Dominican signee from 2014, shows some pop in his bat. Below average arm and lack of speed should push him towards LF.
  • 7. Aramis Garcia 6-2, 220 C from Florida INTL projects as a good bat behind the dish with enough defensive skill to play there long-term
  • 8. Heath Quinn 6-2, 190 OF Strong hitter, makes contact with improving approach at the plate. Returns from hamate bone injury.
  • 9. Garrett Williams 6-1, 205 LHP Former Oklahoma standout, Giants prototype, low-ceiling, high-floor prospect.
  • 10. Shaun Anderson 6-4, 225 RHP Large frame, 3.36 K/BB rate. Can start or relieve
  • 11. Jacob Gonzalez 6-3, 190 3B Good pedigree, impressive bat for HS prospect.
  • 12. Seth Corry 6-2 195 LHP Highly regard HS pick. Was mentioned as possible chip in high profile trades.
  • 13. C.J. Hinojosa 5-10, 175 SS Scrappy IF prospect in the mold of Kelby Tomlinson, just gets it done.
  • 14. Garett Cave 6-4, 200 RHP He misses a lot of bats and at times, the plate. 13 K/9 an 5 B/9. Wild thing.

2019 MLB Draft - Top HS Draft Prospects

  • 1. Bobby Witt, Jr. 6-1,185 SS Colleyville Heritage HS (TX) Oklahoma commit. Outstanding defensive SS who can hit. 6.4 speed in 60 yd. Touched 97 on mound. Son of former major leaguer. Five tool potential.
  • 2. Riley Greene 6-2, 190 OF Haggerty HS (FL) Florida commit.Best HS hitting prospect. LH bat with good eye, plate discipline and developing power.
  • 3. C.J. Abrams 6-2, 180 SS Blessed Trinity HS (GA) High-ceiling athlete. 70 speed with plus arm. Hitting needs to develop as he matures. Alabama commit.
  • 4. Reece Hinds 6-4, 210 SS Niceville HS (FL) Power bat, committed to LSU. Plus arm, solid enough bat to move to 3B down the road. 98MPH arm.
  • 5. Daniel Espino 6-3, 200 RHP Georgia Premier Academy (GA) LSU commit. Touches 98 on FB with wipe out SL.

2019 MLB Draft - Top College Draft Prospects

  • 1. Adley Rutschman C Oregon State Plus defender with great arm. Excellent receiver plus a switch hitter with some pop in the bat.
  • 2. Shea Langliers C Baylor Excelent throw and catch skills with good pop time. Quick bat, uses all fields approach with some pop.
  • 3. Zack Thompson 6-2 LHP Kentucky Missed time with an elbow issue. FB up to 95 with plenty of secondary stuff.
  • 4. Matt Wallner 6-5 OF Southern Miss Run producing bat plus mid to upper 90's FB closer. Power bat from the left side, athletic for size.
  • 5. Nick Lodolo LHP TCU Tall LHP, 95MPH FB and solid breaking stuff.