Showing posts with label The Impact of the Flat Seam Ball. Show all posts

Tuesday, June 26, 2018

What is Happening with the 2018 Home Runs? | Exploring Baseball Data with R

What is Happening with the 2018 Home Runs? | Exploring Baseball Data with R

What is Happening with the 2018 Home Runs?

MLB Report on Home Run Hitting

Last week, Major League Baseball released a report by a scientific committee (including me) that explored the recent increase in home run hitting.    I encourage you to read our report.  One main conclusion was that the 2017 increase in home run hitting was not due to a change in launch angles or exit velocity, but rather a reduction in the drag that results in better carry of the ball.  Given that report, it is interesting to explore what is happening in the 2018 season (through games of May 27).  Are we seeing a similar carry in the balls as we saw in 2017?  I'll perform a brief exploration here.

Home Run Hitting:  2017 and 2018

The first observation is that there is a significant drop in home run hitting this season.   Below I plot the cumulative rate of home runs on balls in play as a function of the date.  Clearly there is a cold-weather effect — the rate of hitting home runs tends to increase through the season — but the 2018 rate is trailing the 2017 rate.  Currently the 2018 rate is under 4.4 % — the 2017 rate at the end of May is about 4.6 %.
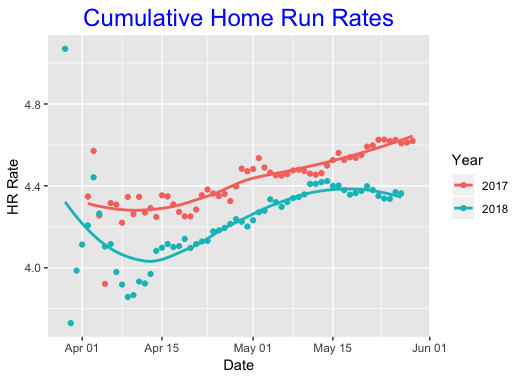
may27hr.png

Change in Launch Speed and Launch Angle?

Okay, maybe there is a drop in the home run rate due to a change in launch angle or launch velocity.  For each season below, I compute the median launch angle (LA), launch speed (LS) and proportion of batted balls hit in the "red zone" (this is a region of the LA, LS space where most of the home runs are hit).  Interesting, 2018 batters are hitting balls at a higher launch angle, higher launch speed, and a higher rate of balls hit in the red zone.  On the basis of these statistics, I'd expect an increase, not a decrease in the home run rate.

Year LA LS P
2016 10.7 89.7 0.180
2017 11.4 89.2 0.183
2018 12.2 90.2 0.194

Home Run Prediction Based on 2017 and 2016 Model Fits

We know there is a strong relationship between the launch angle, launch speed, and occurrence of home runs.  Given the launch angle and launch speed, I fit a generalized additive model that predicts the probability of a home run.  I fit two models — one to data from the complete 2016 season and a second to data from the complete 2017 season.  Using these models, I can predict the number of home runs hit in the 2018 season (through May 27) using the observed launch angles and launch velocities.  

Here is what I found:

Using 2017 model, I predict there would be 2294 home runs.
Using 2016 model, I predict there would be 2110 home runs.

We've only observed 1759 home runs (through May 27) — this is 500 home runs lower than I would be predict using the 2017 model that predicts home runs on the basis of launch speed and launch angles.  So really the drop in home run hitting that we see in the above graph really is conservative — if we adjust for the actual launch angles and launch speeds, the drop is lower.

Reduced Carry

One way of looking at the 2018 season change is to focus on the probability of a home run given specific values of the launch angle and exit velocity.  Let's focus on the values Launch Angle = 30 degrees, Launch Speed = 100 mpg — these values are in the red zone where there is a good probability of a home run.  Here are the probabilities of hitting a home run using models fit to the 2018, 2017 and 2016 seasons:

2018 2017 2016
0.409 0.568 0.502

Here are the home run probabilities using data from only the first part of the baseball season (through late May)

2018 2017 2016
0.409 0.481 0.420

Note that the 2018 estimated probabilities are significantly lower than the 2017 values, even when you adjust for the early part of the season.  In other words, the balls with a particular launch angle and launch speed are experiencing more drag in 2018, at least relative to 2017.

Summing Up

Home run hitting is fascinating to explore since there are potentially many variables including the hitter, the pitcher, the baseball, the weather, ballpark, etc that affect home run production.  There is clearly a decrease in home run hitting in 2018 and balls hit with specific launch angles and launch speeds are less likely to be home runs.  As I noticed, 2018 hitters are actually hitting with higher launch angles and higher launch speeds, but the balls appear to have more drag.  Of course, the big question is why this is happening, and this motivates further exploration.

Added May 29

It is very possible that this home run drop is due to the colder temperatures in 2018.  

Michel Lichtman tweets:

Through May 12 the average temperature at all MLB stadiums in 2018 was 62.7 degrees F. In 2017, it was 65.8, a difference of 3.1 degrees. Plugging those numbers into Dr. Nathan's trajectory calculator those 3.1 extra degrees in 2017 yields a 1.1 foot extra carry on a 100/30 ball.

The suggestion is that the temperature could explain the drop in 2018 home run production

Sent from my iPhone

Friday, June 12, 2015

Midseason report shows Division I baseball home runs up 39 percent | NCAA.com


I don't want to keep beating a dead-horse, because somewhere I fear that even doing so metaphorically might bring the wack-jobs from PETA out of the woodwork, but who didn't see this coming?

from NCAA.com
Midseason report shows Division I baseball home runs up 39 percent | NCAA.com:

INDIANAPOLIS -- The NCAA media coordination and statistics staff released statistical trends for NCAA Division I Baseball comparing 2014 with 2015 through the last weekend of March.

The trends compared the use of the raised seamed baseball that was used by institutions in 2014 to the flat-seamed baseball used in 2015. The biggest statistical change from 2014 to 2015 is an increase in home runs that is up more than 39 percent from 0.36 per game in 2014 to 0.50 per game in 2015.

“The NCAA Division I Baseball Committee is encouraged by the statistical trends using the new baseball in 2015,” said chair Dave Heeke, Associate VP/Director of Athletics at Central Michigan. “The committee looks forward to studying the results the rest of the year and into the championship.”

As of March 29, runs scored in a game are up five percent, and the batting average is basically flat from .268 in 2014 to .269 in 2015. However, this season, strikeouts have risen from 6.64 per nine innings in 2014 to 7.34 per nine innings in 2015, an increase of 10.5 percent. 
 The complete trends report is below.
'via Blog this'


Hat Tip to Dr. Alan Nathan. If you follow the link to the Baseball Prospectus article you get some fascinating information on some further studies Dr. Nathan did with the Houston Astros regarding the factors that change the flight of the ball in mysterious ways. Not any of them related to PED's BTW.


http://baseball.physics.illinois.edu/


Home runs are up 39% in NCAA D1 baseball, as of March 31, 2015. This is a direct result of the improved "carry" from the switch from a raised-seam to a flat-seam baseball. Read about our own testing, as reported in our Baseball Prospectus article.


 http://www.baseballprospectus.com/article.php?articleid=25167

by Alan M. Nathan, Jeff Kensrud, Lloyd Smith and Eric Lang


How Far Did That Fly Ball Travel (Redux)?
Alan Nathan#, Jeff Kensrud*, Lloyd Smith*, Eric Lang#
#Department of Physics, University of Illinois
*Sports Science Laboratory, Washington State University
A couple of years ago, one of us wrote a ProGuestus article entitled "How Far Did That Fly Ball Travel?". The article posed the question: How well does the initial velocity vector (speed and angles) determine the landing point of a fly ball? Utilizing HITf/x data for the initial velocity and ESPN Home Run Tracker for the landing point and hang time, it was determined that the initial velocity vector poorly determines the landing location. Specifically, with a narrow range of initial speed and launch angle, distances in the range 370-440 ft were observed, with a mean of 405 ft and a standard deviation of 16 ft. Much of the rest of the article was devoted to speculation about why that is the case. Variations in air density due to temperature, elevation, and related effects were eliminated by only considering home runs hit in a narrow range of air density. A similar range of distances was observed in covered stadiums, thereby eliminating wind as the primary factor. Two other possible reasons were identified and investigated: variation both in backspin and in the air drag properties of the baseball. The latter is a very intriguing possibility, since variation in the seam height and/or surface roughness of the ball might have a significant effect on the air resistance experienced by the ball.
As a follow-up to this research, we decided to do an experiment under more controlled conditions rather than use MLB game data. Since we wanted to eliminate wind as a possible factor, we approached the Houston Astros organization about using Minute Maid Park (MMP) with the roof closed for our experiment. To our delight, they agreed. So, the four of us gathered in Houston for two cold days last January for the experiment.

Comments:

BP Comment Quick Links


Bryan Cole
Was there any attempt to measure the physical differences between the balls in each MLB lot? If not, what do you think is responsible for the variation in distances?

Dec 09, 2014 11:00 AM
rating: 0

MGL
(2121)
What do you mean by "2 different lots of MLB balls?" Were they merely 2 boxes of balls or were they specifically from two different manufacturing "lots?"

I assume that these were not rubbed up with mud. Do you think that makes a difference - how much mud and perhaps the configuration of mud on the ball?

Dec 09, 2014 12:58 PM
rating: 0

Alan Nathan
Bryan: We measured the weight, diameter, and seam height of each ball. The MLB balls were quite uniform and there was nothing in the physical appearance that gave a clue to their preformance.

MGL: Two different boxes (one dozen each, both boxes previously unopened). Correct, not rubbed with mud. I think the mud does make a difference. But I am not sure if it increases or decreases the uniformity. I can easily convince myself either way. I think the mud roughens the surface, which ought to reduce both the drag and lift (all other things equal). But I don't know how uniformly the ball is rubbed. Good question and something we ought to investigate.

Dec 09, 2014 13:07 PM
rating: 0

BurrRutledge
Fun stuff! Gotta love those Astros.

Test half the balls from a box with multiple successive and identical "hits" through the through the machine. Then test the other half of balls that get rubbed by a pitcher with a rosin bag handy before each of the "hits."

Does a box-fresh ball behave differently than a 'game-used' ball?
Does rubbing a ball with rosin on a pitcher's hands impact the characteristics that affect travel distance? 

Dec 09, 2014 18:15 PM
rating: 0

Alan Nathan
The drag properties of a baseball are affected by small changes to the surface, such as mud, rosin, pine tar, etc. We did not specifically study these effects in our experiment. But the fact that seemingly identical looking baseballs carry differently suggests that it is true.

Dec 10, 2014 02:21 AM
rating: 0

Bryan Cole
I wonder if a professional pitcher would be able to predict which balls would go further. I'm thinking of David Laurilla's interview with Pedro Martinez(http://www.fangraphs.com/blogs/pedro-martinez-on-the-art-and-science-of-pitching/). Could someone like Pedro "feel" that difference?

(Incidentally, he also mentions baseballs with "bad rub" in that article, so I'm guessing the rubbing isn't very uniform.)

Dec 10, 2014 06:30 AM
rating: 0

Alan Nathan
Interesting question, and one that I posed to people I know at Rawlings. Unfortunately, no answer from them.

Dec 10, 2014 09:22 AM
rating: 0

JohnnyB
For the balls which were repeatedly launched, was there any correlation between launch number and distanced traveled (i.e. did it tend to travel longer/shorter on each successive time you re-launched)? Also, it would be interesting to see how contact with a bat effects its travel distance. Balls are switched after pitches in the dirt but not necessarily after a ball is put in play.

Dec 10, 2014 10:48 AM
rating: 0

Alan Nathan
No correlation of the type you asked about. Re your other point, that too would be interesting (but not in the scope of our study).

Dec 10, 2014 10:51 AM
rating: 0


Here, unless you pay for the article you can access the Comments section, which normally on most blogs/web sites, I do not recommend reading unless you want to lower your IQ, where there is some fascinating Q&A that leads to another fascinating Fan Graphs interview with Pedro Martinez (excerpt and link shown below).


Proof positive that you can learn a lot just by wandering around. There was once a management theory built around that premise MBWA ( Management by Wandering Around ) maybe I should promote ILBWA ( Internet Learning by Wandering Around )and make a million writing a book, Nah, too easy!!


https://en.wikipedia.org/wiki/Management_by_wandering_around

  1. The management by wandering around (MBWA), also management by walking around, refers to a style of business management which involves managers wandering around, in an unstructured manner, through the workplace(s), at random, to check with employees, or equipment, about the status of ongoing work.
from Fan Graphs:

 http://www.fangraphs.com/blogs/pedro-martinez-on-the-art-and-science-of-pitching/


Pedro Martinez was a genius with a baseball in his right hand. One of the most dominant pitchers of all time, he didn’t just overpower hitters. He outsmarted them. When he was on top of his game – as he often was – he was almost unhittable. No starting pitcher in history has a better adjusted ERA.
Martinez might be best described as a thinking man’s power pitcher. His pure stuff alone would have made him a star. His ability to read hitters and maximize his talent put him on a whole new level. The Hall of Fame awaits.
Martinez – currently a special assistant for the Red Sox – shared the wisdom of his craft earlier this week at the site of some his greatest glory, Fenway Park.
——
Martinez on the art and science of pitching: “Pitching is both [art and science] and you have to put them together. You have to study a lot. You have to study the movement of your pitches – the distance your pitches move compared to the swing paths of batters. You have to learn to read bat speed against the speed of a fastball. You can tell a slow bat or a long swing, or a short, quick swing. You counter those things. If a hitter has a slow swing, I don’t want to throw him anything soft. I want to go hard against slow. If he has a quick bat, I probably want to be soft more than I want to be hard. You have to be able to repeat your delivery and be deceiving at the same time.


“You repeat – you try to be consistent – until they start to figure out what you’re doing. If they don’t, that’s great. Just go through your routine and repeat, repeat, repeat. I wish I could have just thrown fastballs, but that wasn’t the case. I went along with the way the hitters and the game was going. I let the game come to me. I executed whatever I had to execute.”


On being a student of the game: “I would say the second half in 1996 is when I [made the transition from thrower to pitcher]. After that I felt I was on top of my craft. I felt like I could do what I wanted to do. I’d have off games sometimes, but everybody does. But most of the time I’d be around where I wanted to be. That’s when I feel I was becoming who I wanted to be as a pitcher.


“So much goes into it. You spend as much time as you can watching the game. You watch what the players do and how they do it. That’s how you become better. You never learn how to play ball on your own. If you follow the ball, the ball should teach you. You see over and over, and you repeat over and over what’s going on with the ball – the ball curves, the ball bounces bad, the ball bounces good, the ball is caught, the ball is thrown, the ball is hit. Everything is around the ball.”

Thursday, March 05, 2015

DI committee changes to flat-seamed baseballs for 2015 championship | NCAA.com

Raised Seam Flat Seam Baseballs

Sport Science: NCAA BaseballMLB HD 


http://youtu.be/hYDDaFK_z4Y


According to a survey by the American Baseball Coaches Association:
The coaches were also asked questions pertaining to game excitement and home runs. Seventy-two percent thought the game needed more excitement and 69 percent believe Division I college baseball needs more home runs.
“Even the coaches of programs that have traditionally strong pitching were in favor of going to the flat-seamed baseball.”
Let that last one sink in for a moment - EVEN THE COACHES OF PROGRAMS THAT HAVE TRADITIONALLY STRONG PITCHING understand that CHICKS DIG THE LONG BALL!!!

So, we can conclude that as far as baseball goes, long-term
Offense = Excitement = Higher Ratings
Defense = Boring = Lower Ratings 
We can also conclude that small changes to the ball can produce pretty significant results. Now the NCAA is doing this as a planned process to produce more excitement to the game. I don't know why it's such a leap to speculate that MLB didn't do much the same and just implemented it surreptitiously.  They didn't want to admit that they even needed a fix. At least the NCAA took a hard look at their product and publicly admitted they were making the change so that both pitchers and hitters could make the appropriate adjustments.

  • The ball will travel farther, 
  • Pitches can expect a slicker feel to the ball and initially the"feel" pitches, curves and sliders, will react differently. 
  • The recent changes to bats due to the BBCOR standards penalized fly balls and rewarded grounders more. That dynamic will shift back. 
And this is what TPTB want. Game Over!!!

from NCAA.com
DI committee changes to flat-seamed baseballs for 2015 championship | NCAA.com:
DI committee changes to flat-seamed baseballs for 2015 championship
Greg Johnson | NCAA.com
Last Updated - Jan 10, 2014 15:28 EST  
The Division I Baseball Committee will move to the use of a flat-seamed baseball for its championship, starting with the 2015 Division I tournament.

Currently, raised-seamed baseballs are used in the Division I Baseball Championship.

Committee members made the decision to change to a flat-seamed baseball after research conducted this fall by the Washington State University Sport Science Laboratory showed that flat-seamed baseballs launched out of a pitching machine at averages of 95 mph, a 25-degree angle and a 1,400 rpm spin rate traveled around 387 feet compared to raised-seamed baseballs that went 367 feet.

On the NCAA’s behalf, the Washington State University lab evaluates and certifies baseball bats used in NCAA competition for compliance with bat performance standards.

In the flat-, raised-seamed baseball research, the speed and angles used in the testing were chosen because they are the conditions when typical home runs occur in Division I baseball competition.

Due to variables (individual bat speed, wind direction, whether the ball is stuck on the bat’s “sweet spot,” etc.) that can impact the distance a baseball can travel, not every trajectory hit with a flat-seamed ball will travel exactly 20 feet farther than a raised-seamed ball, but a 20-foot average difference is an approximate representation of what can be expected.

The NCAA’s official supplier of championship baseballs, Rawlings, also conducted testing of the flat-seam balls in its own research lab.  That research was consistent with the findings in the WSU lab.

“We anticipate that this will moderately increase scoring but not take it back to the days where we were dealing with outrageous scores that looked more like football scores,” said Dennis Farrell, who is the committee chair and the commissioner of the Big West Conference. “We want to get the game back to what is a reasonable amount of scoring and defense.”

While the distance the baseball travels is increased due to less drag on the baseball, the health of and safety of the players will not be compromised. The core of the ball and the bat-exit speed will not change.

“We are always sensitive to student-athlete safety issues,” Farrell said. “According to the data we were presented with, those concerns are alleviated. The rationale behind making this change is hoping it will allow certain balls hit at certain trajectories to carry farther.”

Committee members were spurred to look at the research after becoming concerned with diminishing offensive numbers in the Division I Baseball Championship, particularly at the Men’s College World Series site in Omaha.

In the 2013 MCWS, there were only three home runs hit in TD Ameritrade Park Omaha, which opened in 2011. The first year of the new home of the MCWS also marked the year that the bat standards changed to make metal bats perform more like wood bats.

The bat standards were designed to protect pitchers and fielders from increasing bat-exit speeds and to bring balance to the game that was trending heavily toward the offense.

In 2011, there were nine home runs in the MCWS, and in the second year in the park, 10 homers were hit. By contrast in the last year at Rosenblatt Stadium in 2010, 32 homers left the park. Similarly, across all of Division I regular season baseball, offensive performance – batting averages, runs scored and home runs – has been on the decline in recent years.

The difference in the height of the seams between the two baseballs is small. The flatter-seamed ball has a seam height of .031 inches compared to .048 inches for a raised-seam ball. This flatter seam height is consistent with the balls used in minor league baseball, yet still higher than what is used in major league baseball.

The flat-seamed baseball may make it more difficult for pitchers to throw breaking pitches, but college baseball coaches feel their pitchers will be able to adjust over time.

A survey conducted by the American Baseball Coaches Association showed 87 percent of the respondents wanted to change to the flat-seamed baseball. Around 80 percent of the nearly 300 Division I baseball coaches responded to the survey.

The coaches were also asked questions pertaining to game excitement and home runs. Seventy-two percent thought the game needed more excitement and 69 percent believe Division I college baseball needs more home runs.

“The numbers from the survey means the coaches are making a strong statement,” Farrell said. “Even the coaches of programs that have traditionally strong pitching were in favor of going to the flat-seamed baseball.”
'via Blog this'

==

P.S. - Early season results from CheckSwing.com:


from College Baseball Daily:

FROM NCAA.COM
INDIANAPOLIS – The NCAA media coordination and statistics staff released today statistical trends for NCAA Division I Baseball comparing 2014 with 2015 through the first three weeks of the season.
The trends compared the use of the raised seamed baseball that was used by institutions in 2014 to the flat-seamed baseball used in 2015. The biggest statistical change from 2014 to 2015 is an increase in home runs that is up more than 40 percent from 0.33 per game in 2014 to 0.47 per game in 2015. Additional home runs have not led to more total runs. As of March 1, runs scored in a game are up only four percent, and the batting average went from .263 in 2014 to .264 in 2015. This season, strikeouts have risen from 6.81 per nine innings in 2014 to 7.66 per nine innings in 2015.
Weather has also impacted schedules more this year than last year.  On average, each team has played about one fewer game than the same point last year as weather has caused 252 fewer games played in 2015 compared to the same time last year. The complete trends report is below.
2015 NCAA DIVISION I BASEBALL EARLY SEASON TRENDS
Through March 2, 2014Through March 1, 2015Final 2014
TEAMS296295296
Avg. Number of Games Played Per Team9.728.9054.8
BATTING
Batting Average.263.264.270
Runs Per Game5.075.295.08
Home Runs Per Game0.330.470.39 *
Slugging Percentage.352.368.364
Stolen Bases Per Game1.081.091.02
Sacrifice Hits Per Game0.710.640.76
Sacrifice Flies Per Game0.390.360.40
Percentage of RBIs from Sac Flies8.79%7.65%8.74%
PITCHING
Earned-Run Average4.064.364.22
Strikeouts Per Nine Innings6.817.666.48
Shutouts1921561034
Pct. of D1 shutouts per D1 games pitched6.67%5.94%6.37%
FIELDING
Fielding Percentage.964.962.966 **
Averages are per game and per team. | * — Record low for full season. | ** — Record high for full season.
Notes:
• As of March 2, 2014, there were two teams that had not played any games (Brown, Central Conn. State). The 0 games for those teams is calculated in average games per team.
• As of March 1, 2015, there are five teams that have not played any games at this point (Central Conn. State, Fairfield, Massachusetts, NYIT, and Yale). The 0 games for those teams is calculated in average games per team.
• March 1, 2015, statistics also do not include three games involving Alabama A&M and Mississippi Valley which were not reported until well after the deadline. Those numbers are not calculated into the averages.
• Statistics do not include six reclassifying members.

Giants Top Minor League Prospects

  • 1. Joey Bart 6-2, 215 C Power arm and a power bat, playing a premium defensive position. Good catch and throw skills.
  • 2. Heliot Ramos 6-2, 185 OF Potential high-ceiling player the Giants have been looking for. Great bat speed, early returns were impressive.
  • 3. Chris Shaw 6-3. 230 1B Lefty power bat, limited defensively to 1B, Matt Adams comp?
  • 4. Tyler Beede 6-4, 215 RHP from Vanderbilt projects as top of the rotation starter when he works out his command/control issues. When he misses, he misses by a bunch.
  • 5. Stephen Duggar 6-1, 170 CF Another toolsy, under-achieving OF in the Gary Brown mold, hoping for better results.
  • 6. Sandro Fabian 6-0, 180 OF Dominican signee from 2014, shows some pop in his bat. Below average arm and lack of speed should push him towards LF.
  • 7. Aramis Garcia 6-2, 220 C from Florida INTL projects as a good bat behind the dish with enough defensive skill to play there long-term
  • 8. Heath Quinn 6-2, 190 OF Strong hitter, makes contact with improving approach at the plate. Returns from hamate bone injury.
  • 9. Garrett Williams 6-1, 205 LHP Former Oklahoma standout, Giants prototype, low-ceiling, high-floor prospect.
  • 10. Shaun Anderson 6-4, 225 RHP Large frame, 3.36 K/BB rate. Can start or relieve
  • 11. Jacob Gonzalez 6-3, 190 3B Good pedigree, impressive bat for HS prospect.
  • 12. Seth Corry 6-2 195 LHP Highly regard HS pick. Was mentioned as possible chip in high profile trades.
  • 13. C.J. Hinojosa 5-10, 175 SS Scrappy IF prospect in the mold of Kelby Tomlinson, just gets it done.
  • 14. Garett Cave 6-4, 200 RHP He misses a lot of bats and at times, the plate. 13 K/9 an 5 B/9. Wild thing.

2019 MLB Draft - Top HS Draft Prospects

  • 1. Bobby Witt, Jr. 6-1,185 SS Colleyville Heritage HS (TX) Oklahoma commit. Outstanding defensive SS who can hit. 6.4 speed in 60 yd. Touched 97 on mound. Son of former major leaguer. Five tool potential.
  • 2. Riley Greene 6-2, 190 OF Haggerty HS (FL) Florida commit.Best HS hitting prospect. LH bat with good eye, plate discipline and developing power.
  • 3. C.J. Abrams 6-2, 180 SS Blessed Trinity HS (GA) High-ceiling athlete. 70 speed with plus arm. Hitting needs to develop as he matures. Alabama commit.
  • 4. Reece Hinds 6-4, 210 SS Niceville HS (FL) Power bat, committed to LSU. Plus arm, solid enough bat to move to 3B down the road. 98MPH arm.
  • 5. Daniel Espino 6-3, 200 RHP Georgia Premier Academy (GA) LSU commit. Touches 98 on FB with wipe out SL.

2019 MLB Draft - Top College Draft Prospects

  • 1. Adley Rutschman C Oregon State Plus defender with great arm. Excellent receiver plus a switch hitter with some pop in the bat.
  • 2. Shea Langliers C Baylor Excelent throw and catch skills with good pop time. Quick bat, uses all fields approach with some pop.
  • 3. Zack Thompson 6-2 LHP Kentucky Missed time with an elbow issue. FB up to 95 with plenty of secondary stuff.
  • 4. Matt Wallner 6-5 OF Southern Miss Run producing bat plus mid to upper 90's FB closer. Power bat from the left side, athletic for size.
  • 5. Nick Lodolo LHP TCU Tall LHP, 95MPH FB and solid breaking stuff.