
Source: Predicting Baseball: Demystifying Bayes' Theorem

But the real story was Yusmeiro Petit. One good start, you say, OK, maybe it was just a fluke. A second good start, especially one that includes one walk and 10 strikeouts, and you sit up and say, “Hey, Sabes, we may have something here.” To be sure, against all odds, there seems to be some grist to this 28-year-old Venezuelan possibly being a late-bloomer.

Leading statistician and best-selling author Nate Silver will join ESPN later this year in a multifaceted role that will include coverage of sports, economics, culture, science and technology on ESPN's website.
Silver, who rose to fame with his award-winning website, FiveThirtyEight.com, also will appear on ESPN and its broadcast partner, ABC News. FiveThirtyEight.com, which had been hosted on The New York Times website since 2010, will be independent of ESPN but connect to other sites owned by the network and parent company Disney.
Silver gained attention analyzing baseball statistics before he moved to politics. In 2012, FiveThirtyEight.com correctly predicted the presidential election outcome in all 50 states. The site will include forecasts of the 2014 and 2016 elections.
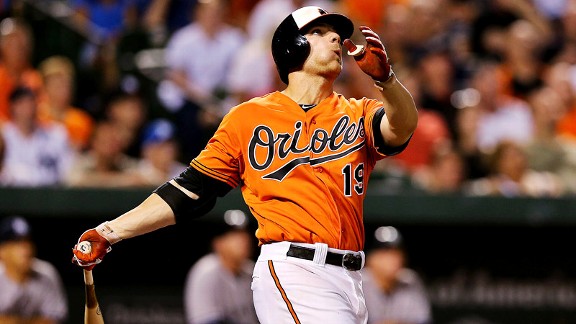
Take, for instance, Chris "Crush" Davis, the Baltimore Orioles first baseman who's suddenly hitting like he was bitten by a radioactive spider. He has 31 home runs. That's two fewer than his career best, and it's not even the All-Star break. Entering Wednesday, he's hitting .329. That's 59 points higher than his lifetime average. He's on pace to double his best RBI season.
And in a contract year, no less.
So say it with me: "It's gotta be the steroids."
Davis can explain everything, of course. He says he went from Bernie Williams to Ted Williams because "I'm just making more consistent contact," he says. Also, he switched to a bigger bat.
And he fixed a couple of holes in his swing.
But this is a guy who's spent most of his career bouncing from the bushes to the bigs. In fact, in four seasons of facing Triple-A pitching, he hit only 54 home runs. Now, in one major league season, he's on pace to hit 62? That must be some new bat.
1. In baseball, unexplained change in performance are the norm not the exception: once you control for park and league effects, "power spike" in which established veterans have increased their HR rates by at least 10 HR's per 650 plate appearances have been fairly consistent across eras. ( see Chris Davis and Joey Bats in Toronto )
2. Relatively few players are steroid users... Even if testing is catching only a fraction of users, it seems that >50% estimates are inaccurate.
3. Marginal players are more inclined than star performers to use steroids. ( see players implicated in the most recent HGH scandal, there will be some headliners and a lot of guys named Joe )
4. The average performance improvement from steroid use is detectable, but small: Silver estimates an average effect of 10 points to BA, OBP and SLG for position players and statistically insignificant gains for a pitcher


| ( 2008-10 model ) D=37.5 R=34.0 I=28.5 Hold Rate 91.5% I's split=55-45 | |||||||
| ( 2012 model ) D = 32 R = 28 I = 38+2 (Gallup 2012) Hold Rate R=90 D=85, I's split=55-45 Here Romney gets to 52.00% Obama gets to 48.00% |
"I haven’t pulled apart all the pieces of Chambers’ model, but my main objection to UnskewedPolls is that it re-weights the electorate twice:
The QStarNews poll works with the premise that the partisan makeup of the electorate 34.8 percent Republicans, 35.2 percent Democrats and 30.0 percent independent voters. Additionally, our model is based on the electorate including approximately 41.0 percent conservatives, 20.0 percent moderates and 39.0 percent liberals.
Republicans are 89 percent conservative, 9 percent moderate and 2 percent liberal. Among Democrats, 3 percent are conservative, 23 percent are moderate and 74 percent are liberal. Independents include 33 percent conservatives, 49 percent moderates and 18 percent liberals.
Our polls are doubly-weighted, to doubly insure the results are most accurate and not skewed, by both party identification and self-identified ideology. For instance, no matter how many Republicans answer our survey, they are weighted at 34.8 percent. If conservatives are over-represented among Republicans in the raw sample, they are still weighted at 89 percent of Republicans regardless."
Moneyball and PECOTA’s WorldLet me use an analogy from baseball statistics, which I think is appropriate here because it’s where both I and Nate Silver first learned to read statistics critically and first got an audience on the internet: in terms of their predictive power, poll toplines are like pitcher win-loss records or batter RBI.At a very general level, the job of a baseball batter is to make runs score, and the job of a baseball pitcher is to win games, so traditionally people looked at W-L records and RBI as evidence of who was good at their jobs. And it’s true that any group of pitchers with really good W-L record will, on average, be better than a group with bad ones; any group of batters with a lot of RBI will, on average, be better than a group with very few RBI. If you built a model around those numbers, you’d be right more often than you’d be wrong.But wins and RBI are not skills; they are the byproducts of other skills (striking people out, hitting home runs, etc.) combined with opportunities: you can’t drive in runners who aren’t on base, and you can’t win games if your team doesn’t score runs. If you build your team around acquiring guys who get a lot of RBI and wins, you may end up making an awful lot of mistakes. Similarly, you can’t win the votes of people who don’t come to the polls.Baseball analysis has come a long way in recent decades, because baseball is a closed system: nearly everything is recorded and quantified, so statistical analysis is less likely to founder on hidden, uncounted variables. Yet, even highly sophisticated baseball models can still make mistakes if they rest on mistaken assumptions. Baseball Prospectus.com’s PECOTA player projection system – designed by Nate Silver and his colleagues at BP – is one of the best state-of-the-art systems in the business. But one of PECOTA’s more recent, well-known failures presents an object lesson. In 2009, PECOTA projected rookie Orioles catcher Matt Wieters to hit .311/.395/.546 (batting/on base percentage/slugging). As regular consumers of PECOTA know, this is just a probabilistic projection of his most likely performance, and the actual projection provided a range of possible outcomes. But the projection clearly was wrong, and not just unsuccessful. While Wieters has developed into a good player, nothing in his major league performance since has justfied such optimism: Wieters hit .288/.340/.412 as a rookie, and .260/.328/.421 over his first four major league seasons. What went wrong? Wieters had batted .355/.454/.600 between AA and A ball in 2008, and systems like PECOTA are supposed to adjust those numbers downward for the difference in the level of competition between A ball, AA ball and the major leagues. But as Colin Wyers noted at the time, the problem was that the context adjustments used by PECOTA that season used an unusually generous translation, assuming that the two leagues Wieters had played in – the Eastern League and the Carolina League – were much more competitive in 2008 than they had been in previous years. By getting the baseline of the 2008 environment Wieters played in wrong, PECOTA got the projection wrong, a projection that was out of step with what other models were much more realistically projecting at the time. The sophistication of the PECOTA system was no match for two bad inputs in the historical data.My point is not to beat up on PECOTA, which as I said is a fantastic system and much better than anything I could design. Let’s consider for a further example one of PECOTA’s most notable successes, one where I questioned Nate Silver at the time and was wrong; I think it also illustrates the differing approaches at work here. In 2008, PECOTA projected the Tampa Bay Rays to win 88-89 games, a projection that Nate Silver touted in a widely-read Sports Illustrated article. It was a daring projection, seeing as the Rays had lost 95 or more games three years running and never won more than 70 games in franchise history. As Silver wrote, “[i]t’s in the field…that the Rays will make their biggest gains…the Rays’ defense projects to be 10 runs above average this year, an 82-run improvement.” I wrote at the time: “this is nuts. Last season, Tampa allowed 944 runs (5.83 per game), the highest in the majors by a margin of more than 50 runs. This season, BP is projecting them to allow 713 runs (4.40 per game), the lowest in the AL, third-lowest in the majors…and a 32% reduction from last season…it’s an incredibly ambitious goal.”PECOTA was right, and if anything was too conservative. The Rays won 97 games and went to the World Series, without any improvement by their offense, almost entirely on the strength of an improved defense. I later calculated that their one-year defensive improvement was the largest since 1878. Looking at history and common sense, I was right that PECOTA was projecting an event nearly unprecedented in the history of the game, and I would raise the same objection again. But the model was right in seeing it coming.If you looked closely, you could see why: the frontiers of statistical analysis had shifted. Michael Lewis’ book Moneyball, following the 2002 Oakland A’s, captured the era when statistical analysts stressed hitting and de-emphasized fielding on the theory that it was easier to use sophisticated metrics to find better hitters, but harder to quantify the benefits of defense. By 2008, the metrics were creating more opportunities to study defense, and – as captured in Jonah Keri’s book The Extra 2% (about the building of that Rays team) – the Rays took advantage.But for the Rays, the 2008 environment was not so easily repeated in subsequent years. While still a successful club with a solid defense in a pitcher’s park (and still far better defensively than in 2007) they have led the league in “Defensive Efficiency Rating” only once in the past four years. It’s what Bill James called the Law of Competitive Balance: unsuccessful teams adapt more quickly to imitate the successes of the successful teams, bringing both sides closer to parity. Trende, in his book The Lost Majority, applies the same essential lesson to political coalitions. Assuming that the 2008 turnout models, which depended heavily on unusually low Republican turnout, still apply to Obama’s current campaign ignores the extent to which multiple factors favor a balance swinging back to the Republicans. And the polls that make up the averages – averages upon which Nate Silver’s model rests – are doing just that. Nate’s model might well work in an election where the relationship between the internals and the toplines was unchanged from 2008. But because that assumption is an unreasonable one, yet almost by definition not subject to question in his model, the model is delivering a conclusion at odds with current, observable political reality.
