What is Happening with the 2018 Home Runs?
MLB Report on Home Run Hitting
Last week, Major League Baseball released a report by a scientific committee (including me) that explored the recent increase in home run hitting. I encourage you to read our report. One main conclusion was that the 2017 increase in home run hitting was not due to a change in launch angles or exit velocity, but rather a reduction in the drag that results in better carry of the ball. Given that report, it is interesting to explore what is happening in the 2018 season (through games of May 27). Are we seeing a similar carry in the balls as we saw in 2017? I'll perform a brief exploration here.
Home Run Hitting: 2017 and 2018
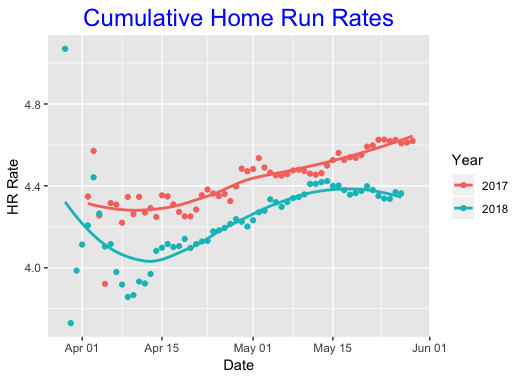
The first observation is that there is a significant drop in home run hitting this season. Below I plot the cumulative rate of home runs on balls in play as a function of the date. Clearly there is a cold-weather effect — the rate of hitting home runs tends to increase through the season — but the 2018 rate is trailing the 2017 rate. Currently the 2018 rate is under 4.4 % — the 2017 rate at the end of May is about 4.6 %.

Change in Launch Speed and Launch Angle?
Okay, maybe there is a drop in the home run rate due to a change in launch angle or launch velocity. For each season below, I compute the median launch angle (LA), launch speed (LS) and proportion of batted balls hit in the "red zone" (this is a region of the LA, LS space where most of the home runs are hit). Interesting, 2018 batters are hitting balls at a higher launch angle, higher launch speed, and a higher rate of balls hit in the red zone. On the basis of these statistics, I'd expect an increase, not a decrease in the home run rate.
Year LA LS P
  2016 10.7 89.7 0.180
  2017 11.4 89.2 0.183
  2018 12.2 90.2 0.194
Home Run Prediction Based on 2017 and 2016 Model Fits
We know there is a strong relationship between the launch angle, launch speed, and occurrence of home runs. Given the launch angle and launch speed, I fit a generalized additive model that predicts the probability of a home run. I fit two models — one to data from the complete 2016 season and a second to data from the complete 2017 season. Using these models, I can predict the number of home runs hit in the 2018 season (through May 27) using the observed launch angles and launch velocities.
Here is what I found:
Using 2017 model, I predict there would be 2294 home runs.
Using 2016 model, I predict there would be 2110 home runs.
Using 2016 model, I predict there would be 2110 home runs.
We've only observed 1759 home runs (through May 27) — this is 500 home runs lower than I would be predict using the 2017 model that predicts home runs on the basis of launch speed and launch angles. So really the drop in home run hitting that we see in the above graph really is conservative — if we adjust for the actual launch angles and launch speeds, the drop is lower.
Reduced Carry
One way of looking at the 2018 season change is to focus on the probability of a home run given specific values of the launch angle and exit velocity. Let's focus on the values Launch Angle = 30 degrees, Launch Speed = 100 mpg — these values are in the red zone where there is a good probability of a home run. Here are the probabilities of hitting a home run using models fit to the 2018, 2017 and 2016 seasons:
2018 2017 2016
  0.409 0.568 0.502
Here are the home run probabilities using data from only the first part of the baseball season (through late May)
2018 2017 2016
  0.409 0.481 0.420
Note that the 2018 estimated probabilities are significantly lower than the 2017 values, even when you adjust for the early part of the season. In other words, the balls with a particular launch angle and launch speed are experiencing more drag in 2018, at least relative to 2017.
Summing Up
Home run hitting is fascinating to explore since there are potentially many variables including the hitter, the pitcher, the baseball, the weather, ballpark, etc that affect home run production. There is clearly a decrease in home run hitting in 2018 and balls hit with specific launch angles and launch speeds are less likely to be home runs. As I noticed, 2018 hitters are actually hitting with higher launch angles and higher launch speeds, but the balls appear to have more drag. Of course, the big question is why this is happening, and this motivates further exploration.
Added May 29
It is very possible that this home run drop is due to the colder temperatures in 2018.
Michel Lichtman tweets:
Through May 12 the average temperature at all MLB stadiums in 2018 was 62.7 degrees F. In 2017, it was 65.8, a difference of 3.1 degrees. Plugging those numbers into Dr. Nathan's trajectory calculator those 3.1 extra degrees in 2017 yields a 1.1 foot extra carry on a 100/30 ball.
The suggestion is that the temperature could explain the drop in 2018 home run production
Sent from my iPhone
No comments:
Post a Comment